mean, median, and 5. A speech pathologist collects data from 10 people for an experiment. Each person answers 6 questions. The speech pathologist records the number of questions that each person correctly answered and puts each person's data in the line plot. The median of the data is 3.5, and the mode of the data is 2. Complete the line plot so that the plot matches the pathologist's data. Place an X onto the graph as many times as necessary to represent the data. Experiment Data х х 2 3 4 6. Number of Questions Correctly Answered
mean, median, and 5. A speech pathologist collects data from 10 people for an experiment. Each person answers 6 questions. The speech pathologist records the number of questions that each person correctly answered and puts each person's data in the line plot. The median of the data is 3.5, and the mode of the data is 2. Complete the line plot so that the plot matches the pathologist's data. Place an X onto the graph as many times as necessary to represent the data. Experiment Data х х 2 3 4 6. Number of Questions Correctly Answered

MATLAB: An Introduction with Applications
6th Edition
ISBN:9781119256830
Author:Amos Gilat
Publisher:Amos Gilat
Chapter1: Starting With Matlab
Section: Chapter Questions
Problem 1P

Related questions
Question
100%

Transcribed Image Text:Complete the
what you know about
mean, median, and mode.
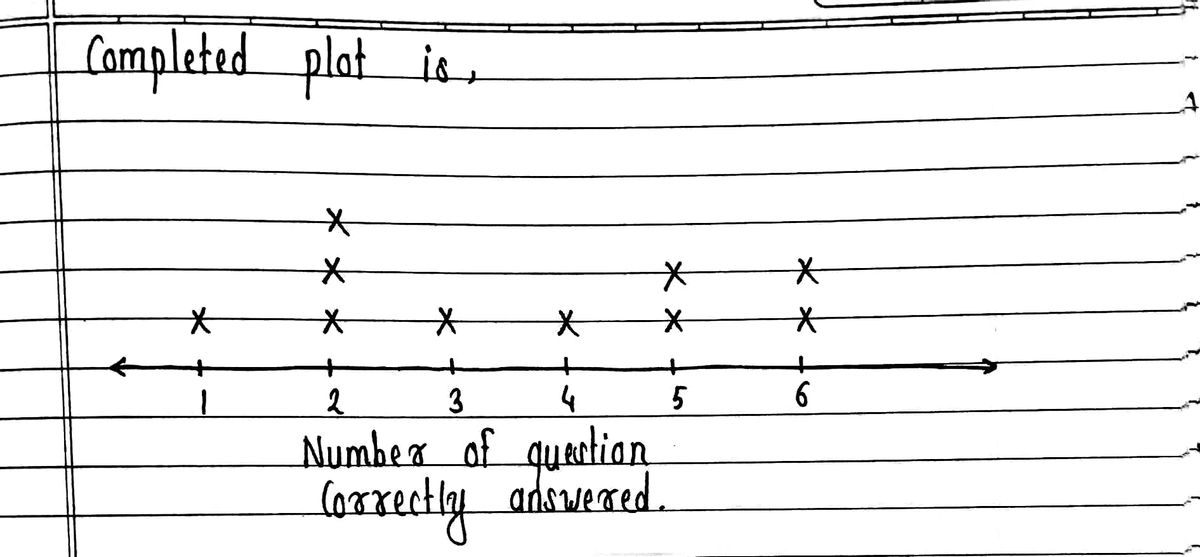
5. A speech pathologist collects data
from 10 people for an experiment.
Each person answers 6 questions. The
speech pathologist records the number
of questions that each person correctly
answered and puts each person's data in
the line plot. The median of the data is 3.5,
and the mode of the data is 2. Complete
the line plot so that the plot matches the
pathologist's data.
Place an X onto the graph as many times
as necessary to represent the data.
Experiment Data
X.
х х
+-
2
3
4 5
Number of Questions
Correctly Answered
Expert Solution
Step 1

Trending now
This is a popular solution!

Step by step
Solved in 2 steps with 1 images

Recommended textbooks for you
MATLAB: An Introduction with Applications
Statistics
ISBN:
9781119256830
Author:
Amos Gilat
Publisher:
John Wiley & Sons Inc

Probability and Statistics for Engineering and th…
Statistics
ISBN:
9781305251809
Author:
Jay L. Devore
Publisher:
Cengage Learning

Statistics for The Behavioral Sciences (MindTap C…
Statistics
ISBN:
9781305504912
Author:
Frederick J Gravetter, Larry B. Wallnau
Publisher:
Cengage Learning
MATLAB: An Introduction with Applications
Statistics
ISBN:
9781119256830
Author:
Amos Gilat
Publisher:
John Wiley & Sons Inc
Probability and Statistics for Engineering and th…
Statistics
ISBN:
9781305251809
Author:
Jay L. Devore
Publisher:
Cengage Learning
Statistics for The Behavioral Sciences (MindTap C…
Statistics
ISBN:
9781305504912
Author:
Frederick J Gravetter, Larry B. Wallnau
Publisher:
Cengage Learning

Elementary Statistics: Picturing the World (7th E…
Statistics
ISBN:
9780134683416
Author:
Ron Larson, Betsy Farber
Publisher:
PEARSON

The Basic Practice of Statistics
Statistics
ISBN:
9781319042578
Author:
David S. Moore, William I. Notz, Michael A. Fligner
Publisher:
W. H. Freeman

Introduction to the Practice of Statistics
Statistics
ISBN:
9781319013387
Author:
David S. Moore, George P. McCabe, Bruce A. Craig
Publisher:
W. H. Freeman