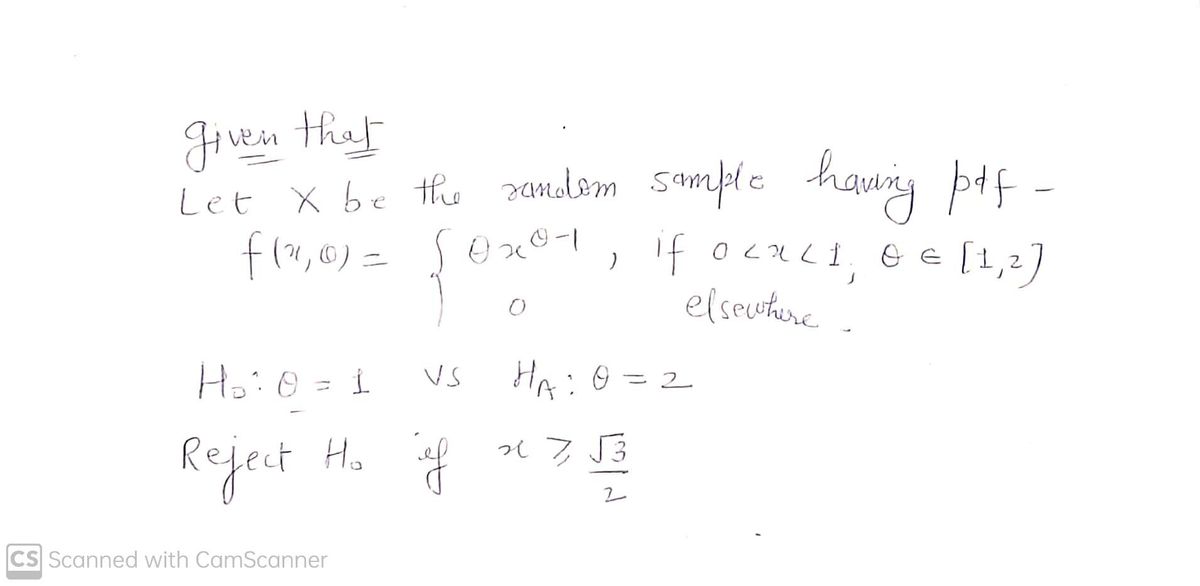
Let X to be a random sample from a distribution with a probability density function given by f(x; 0) = (0x0-1 .0, ,if 0 < x < 1, 0 € {1,2}, elsewhere It is desired to test a null hypothesis Hå:0 = 1 against the alternative hypothesis H₁:0 = 2. Suppose that the test rejects H₁ if x ≥ 3. i) Calculate the power of the test.
Q: How interested are you about preservation of the environment? 49 responses 28.6% 53.1% 16.3% Very…
A: From the survey, it is observed that 14 responses or 28.6% are somewhat interested, 26 responses or…
Q: Partially Correct Expression 3: Your answer is incorrect. Suppose that X, Y, and Z are jointly…
A: GivenE(X)=9 E(Y)=-5 E(Z)=-6Var(X)=37 Var(Y)=23 Var(Z)=24
Q: Osuppose an insect lays between 30 and 50 eggs per unit time, with equal chance. The probability of…
A:
Q: 1. A researcher has developed a new test of self-esteem. To evaluate the reliability of the test,…
A: 1. The data shows the two test scores for each individual of 8 participants.
Q: Imagine you have designed a test for detecting whether a dog has a common parasitic infection. 10%…
A: Given information: PI=0.10PT|Ic=0.10PTc|I=0.05 Where, I= infected dogsT=test positiveTc=test…
Q: Question Dr. King is concerned that STA 2381 students aren't studying enough. There are 7 sections…
A: A variable is a characteristic that is being measured.
Q: A CEO claims that men and women working for his company have equal opportunities to earn bonuses. A…
A: We have given that Sample size N1=315 ,N2=232 And Favorable cases X1=287, X2=187 Alpha =0.05
Q: A grocery store manager wants to know if displaying cranberries near the entrance to the store…
A: P1 : Proportion of shoppers who buy Cranberries when they are near the store entrance. P2 :…
Q: a. Which if these estimators are unbiased for 6? b. Among the unbiased estimators, which has the…
A:
Q: Data set 20 in Appendix B of the textbook lists data from 100 M&M’s, and 8% of them are yellow. Use…
A: From the provided information, Sample size (n) = 100 Sample proportion (p̂) = 0.08 Level of…
Q: The data in the table below came from randomized controlled trials that tested the · effectiveness…
A: Given information: dth_plac tot_plac dth_asp tot_asp Elwood_etal_1974 67 624 49 615…
Q: Fast reactions: In a study of reaction times, the time to respond to a visual stimulus x and the…
A: Enter data as follows The regression output is as follows
Q: The following table represents the outcome of two drugs therapies on 63 leukemia patients. The…
A: Given:
Q: Directions: A random sample of 10 Grade 7 students has grades in MAPEH, where marks range from 90…
A: Given data Sample size = 10 student grade 1 92 2 95 3 95 4 96 5 97 6 98 7 95 8…
Q: Biration 20,20. In a recent diet survey the following results were found in an Indian city: No. of…
A:
Q: In randomized, double-blind clinical trials of a new vaccine, rats were randomly divided into two…
A: Given that,For experimental group:The sample size is 699.The random variable represents number of…
Q: You want to buy a microwave oven and will choose Model A if its repair costs are lower than Model…
A: μ1 = mean repair cost of model A μ2 = mean repair cost of model B Null Hypothesis : H0 : μ1 ≥ μ2…
Q: 1- Events A and B are independent events and P[A|B] = 0.3. P[A] is %3D
A: Hi! Thank you for the question, As per the honor code, we are allowed to answer one question at a…
Q: 9.12. (a) Are independent random processes orthogonal? Explain. (b) Are orthogonal random processes…
A: Orthogonal random processes have E(XY)=0. Independent random processes have E(XY)=E(X)E(Y) and…
Q: Part (c) Do you reject the null at a 5% level ✓ [Select] Yes No There are 6 parts to this question.…
A: Regression analysis To test: H0: Coefficient of X=0, i.e. there is no relationship between…
Q: 7 A study of the post treatment behavior of a large number of drug abusers suggests that the…
A: (a) 0.30(b) 0.36(c) 0.20(d) 0.46(e) 0.70(f) 0.54(g) 0.80(h) 0.56(i) 0.67Explanation: (a) P(A) from…
Q: Two Factor ANOVA How do i fill in the missing values on the chart and find out if the interaction…
A: The two-way ANOVA table with some missing values are given in the data.
Q: the Kolmogorov smirnov statistic test the no hypothesis that the variables in the population are…
A: Introduction Kolmogorov Smirnov (KS) test is a non-parametric test.
Q: Make the statistical analysis for all of data given into table below using Excel program. Show your…
A: Given : COUNT X 1 0.244(N) 2 0.234(N) 3 0.247(N) 4 0.231(N) 5…
Q: For this analysis, the “exercise” variable was divided into 4 approximately equally-sized groups:…
A: The task here is to compare the average of four groups. This will be done by ANOVA. The hypothesis…
Q: Independent t-tests compare data about a. two distinct groups of similar (dependent) respondents…
A: We have given that, Independent t-tests compare data about a. two distinct groups of similar…
Q: Is there evidence of an association between the duration of the pregnancy and the level of care…
A: Given: Preterm (induced or cesarean Preterm (without procedures) Term or post term Total…
Q: Ecology: Shark Attacks In Hawaii shark attacks are very rare. Furthermore, about 55%of all shark…
A: A binomial distribution is a discrete distribution which is used to estimate the probability of x…
Q: PE & SELF-ESTEEM PART 1 of 4 What type of test should this researcher use?
A: It can be observed that the sample size is large(greater than 30) and population standard deviation…
Q: sing specific data, we find a significant difference in the proportion of fruit flies surviving…
A: Solution-: Given: P^_o = 0.69 P^_c=0.67 Standard error = SE= phat_o-phat_c =0.03 Significance…
Q: end of pregancy. The incident of miscarrige was self-reported if occurred. Compute the population…
A: Introduction - Population attributable Risk PAR=Risk(total pop)-Risk(unexposed)Risk(Total Pop)
Q: Is there a statistically significant difference between the proportion of citizens in the United…
A: Solution
Q: Question Let X and Y be two random variable with E(X) = 1,Var(X) = 2, E(Y) = 2,Var(Y)%3D 2. Then…
A:
Q: Pull sample with return? Pull sample without return with no arrangement? Pull sample without return…
A: Given: Population: A , B , C ,D sample size =2
Q: Suppose a sample of 30 students were given a diagnostic test before studying a particular module and…
A: In the given information, the test scores for the students before and after completing the module.…
Q: A restaurant wants to test two different recipes of a restaurant meal. It offers the meal using one…
A: Experimental studies are those in which investigators introduce an intervention and study the…
Q: Cause Percentage My opinion Personal iliness Related issues Peraonal needs 2021-03-29 17:30
A: to fill the table
Q: The first test a doctor would order to determine whether a person is infected with HIV (the virus…
A: Note: As per our Honor code policy, we are authorized to answer only three sub parts at a time. So,…
Q: Fast reactions: In a study of reaction times, the time to respond to a visual stimulus x and the…
A: The data set is,Visual (x)Auditory (y)161159176163201197191169203206235241178201188197The…
Q: A survey¹ asked a random sample of n = 2752 US adults whether they had visited a public library in…
A: From the provided information,
Q: 14/21 OPEC crude oil imports. The data in the table below are the amounts of crude oil (millions of…
A: The objective of this question is to construct two exponentially smoothed series for the given time…
Q: Fin the blank Suppose Bank of America (B of A) would ke to investigate f credit score and income…
A: Given: Contingency table for credit score and income level. The expected number of individuals with…
Q: Four histograms are displayed below. These histograms are labelled Histogram A, Histogram B,…
A: Solution: Four histograms are given and labelled as A, B, C and D.
5b.STATISTICAL INFERENCE
Given that
We have to calculate
b..power of the test
Step by step
Solved in 3 steps with 2 images
- Smoking 2009, women and men In Exercise 2, we ex-amined the percentage of men aged 18–24 who smoked from 1965 to 2009 according to the Centers for DiseaseControl and Prevention. How about women? Here’s ascatterplot showing the corresponding percentages forboth men and women:a) In what ways are the trends in smoking behaviorsimilar for men and women?b) How do the smoking rates for women differ fromthose for men?c) Viewed alone, the trend for men may have seemed toviolate the Linearity Condition. How about the trendfor women? Does the consistency of the two patternsencourage you to think that a linear model for thetrend in men might be appropriate? (Note: there is nocorrect answer to this question; it is raised for you tothink about.)Aspirin III: Decision and Conclusion Regarding the experiment in the data frame Aspirin from the abd package, the researchers wanted to know whether or not taking aspirin affects one's risk of developing cancer. Recall that they defined their parameters as follows: p1 = the proportion of ALL individuals who would develop cancer, if all of them were to take aspirin like the subjects in the Aspirin group did. p2 = the proportion of ALL individuals who would develop cancer, if all of them were to take a placebo, like the subjects in the placebo group did. They ran the code for a two-sided significance test and got the following results: ## ## ## Inferential Procedures for the Difference of Two Proportions p1-p2:## cancer grouped by treatment ## ## ## Descriptive Results:## ## yes n estimated.prop## Aspirin 1438 19934 0.07214## Placebo 1427 19942 0.07156## ## ## Inferential Results:## ## Estimate of p1-p2: 0.0005805 ## SE(p1.hat - p2.hat): 0.002586 ## ##…Tip at least 20% Tip less than 20% Works or worked in service industry 22 5 Never worked in service industry 36 8 Find P(individual has worked a service industry job) (2) Find P(individual either has never worked in the service industry or tips less than 20%) (4) Find P(individual has never worked in the service industry and tips less than 20%) (4) Find P(Tipping at least 20% | Service industry worker) (4) Find P(Two people both tip at least 20%)
- Question 1c neededMm2Hypothesis Testing Question: Is there a statistically significant difference between the proportion of citizens in the United States and Japan without underlying health conditions who have been hospitalized after a COVID-19 diagnosis? The proportion of Americans and Japanese from nationally representative samples of adult citizens from each country who have been hospitalized for one or more days due to COVID-10 infection is reported below. Please include all steps of the five step model and write a sentence or two interpreting your results (use p= .01, Z(critical) = ± 2.58). Americans Japanese Ps1 = .07 Ps2 = .04 N1 = 1325 N2 = 1287
- K Are you an impulse shopper? A survey of 800 grocery shoppers indicated that 18% of males and 50% of females make an impulse purchase every time they shop. Assume that the survey consisted of 400 males and 400 females. Complete parts (a) and (b) below. search State the conclusion.. the null hypothesis. There is evidence at the 0.05 level of significance to conclude that there is a difference in the proportion of males and females who make an impulse purchase every time they shop. b. Find the p-value in (a) and interpret its meaning. The p-value is (Round to three decimal places as needed.). Interpret the p-value. The p-value is the probability that in a random sample of 800 adults, the difference between the proportions of males and females who make an impulse purchase the difference in this sample, assuming that the proportion of males who make an impulse purchase every time every time they shop will be the proportion for females in the population. they shop is #1 I C 86°F VSIA 441Example: Independent t-Test ● A group of 30 people jump into the Atlantic. Their temperature is taken immediately when they get out of the water (mean = 96.3). At the same time, the temperatures of 30 random people waiting on the beach are also taken (mean = 98.4). Do the two groups significantly differ? ● a) What hypothesis test? ● b) Assumptions? (pretend they've all been met) c) Hypotheses? ● ● d) If SE= .6, what is the test statistic? ● e) df=?, Critical value=2.000 f) Conclusion? g) 95% Cl of the drop in temperature? ● ●Part (i) The chance of developing breast cancer is under 11% for women. Ho: M=11, Hg μ#11 Ho: M211, Hg: μ 11 Ho: p=0.11, H₂: P# 0.11 O Ho: Ho: P 20,000, Ο Ηρ: μ 5 20,000, O Ho: p = 20,000, O Ho: p ≤ 20,000, O Ho:p> 20,000, Ho: μ ε 20.000, O Ho: p≥ 20,000, Additional Materials Reading Hg μ 5 20,000 Hg μ > 20,000 Ha: p= 20,000 Hp> 20,000 He: p ≤ 20,000 Hg με 20,000 Ha: p<20,000
- Seniority and salary:|A personnel specialist with a large accounting firm is interested in determining the relationship between seniority and hourly wages for administrative assistants. She randomly selected 21 administrative assistants and records their years with the company and hourly wage. Seniorit 2 3 6 5 3 1 1 2 3 5 4 1 2 3 4 4 Wage 1 1 1 1 2 1 1 1 1 1 1 1 1 1 1 1 1 1 1 1 1 5 4 4 3 2 5 5 4 3 2 3 4 3 3 6. 5 Is seniority related to hourly wage? How does the specialist know? What hourly wage would the specialist predict for an administrative assistant with 3 years seniority? How would she make this prediction? H stA fair coin is tossed three times. Let X be number of heads. (1) Write out the sample space. (2) Find P(X=2) (3) Find E(X)Cost of shopping Do consumers spend more on a trip toWalmart or Target? Suppose researchers interested in thisquestion collected a systematic sample from 85 Walmartcustomers and 80 Target customers by asking customersfor their purchase amount as they left the stores. The datacollected is summarized in the table below.To perform inference on these two samples, what condi-tions must be met? Are they? Explain. Walmart Targetn 85 80y $45 $53s $21 $19