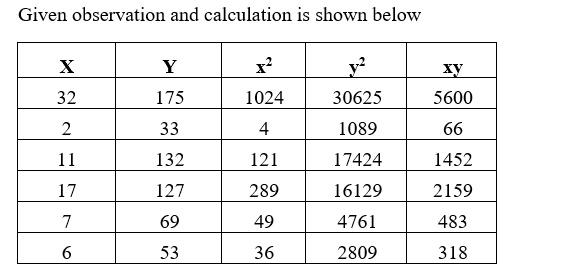
Let x be a random variable representing percentage change in neighborhood population in the past few years, and let y be population). A random sample of six Denver neighborhoods gave the following information. X y y = b= ŷ = Σx = 75; Σy = 589; Σx2 = 1,523; Ey² = 72,837; Exy = 10,078 (a) Find x, y, b, and the equation of the least-squares line. (Round your answers for x and y to two decimal places. X= 200 150 32 2 175 33 100 50 11 132 + (b) Draw a scatter diagram for the data. Plot the least-squares line on your scatter diagram. y y 6 17 7 127 69 53 X 200 150 100 50
Let x be a random variable representing percentage change in neighborhood population in the past few years, and let y be population). A random sample of six Denver neighborhoods gave the following information. X y y = b= ŷ = Σx = 75; Σy = 589; Σx2 = 1,523; Ey² = 72,837; Exy = 10,078 (a) Find x, y, b, and the equation of the least-squares line. (Round your answers for x and y to two decimal places. X= 200 150 32 2 175 33 100 50 11 132 + (b) Draw a scatter diagram for the data. Plot the least-squares line on your scatter diagram. y y 6 17 7 127 69 53 X 200 150 100 50

MATLAB: An Introduction with Applications
6th Edition
ISBN:9781119256830
Author:Amos Gilat
Publisher:Amos Gilat
Chapter1: Starting With Matlab
Section: Chapter Questions
Problem 1P

Related questions
Question

Transcribed Image Text:Let x be a random variable representing percentage change in neighborhood population in the past few years, and let y be a
population). A random sample of six Denver neighborhoods gave the following information.
32
IX IN
| Y
Ex = 75; Ey = 589; Ex² = 1,523; Σy² = 72,837; Exy = 10,078
(a)
Find x, y, b, and the equation of the least-squares line. (Round your answers for x and y to two decimal places. R
II
D =
200
150
(b) Draw a scatter diagram for the data. Plot the least-squares line on your scatter diagram.
y
y
100
7
69
+
50
6
200
150
100
50
Expert Solution
Step 1
Given information-
We have given the x = percentage change in the neighborhood population
y = dependent variable

Step by step
Solved in 2 steps with 4 images

Recommended textbooks for you
MATLAB: An Introduction with Applications
Statistics
ISBN:
9781119256830
Author:
Amos Gilat
Publisher:
John Wiley & Sons Inc

Probability and Statistics for Engineering and th…
Statistics
ISBN:
9781305251809
Author:
Jay L. Devore
Publisher:
Cengage Learning

Statistics for The Behavioral Sciences (MindTap C…
Statistics
ISBN:
9781305504912
Author:
Frederick J Gravetter, Larry B. Wallnau
Publisher:
Cengage Learning
MATLAB: An Introduction with Applications
Statistics
ISBN:
9781119256830
Author:
Amos Gilat
Publisher:
John Wiley & Sons Inc
Probability and Statistics for Engineering and th…
Statistics
ISBN:
9781305251809
Author:
Jay L. Devore
Publisher:
Cengage Learning
Statistics for The Behavioral Sciences (MindTap C…
Statistics
ISBN:
9781305504912
Author:
Frederick J Gravetter, Larry B. Wallnau
Publisher:
Cengage Learning

Elementary Statistics: Picturing the World (7th E…
Statistics
ISBN:
9780134683416
Author:
Ron Larson, Betsy Farber
Publisher:
PEARSON

The Basic Practice of Statistics
Statistics
ISBN:
9781319042578
Author:
David S. Moore, William I. Notz, Michael A. Fligner
Publisher:
W. H. Freeman

Introduction to the Practice of Statistics
Statistics
ISBN:
9781319013387
Author:
David S. Moore, George P. McCabe, Bruce A. Craig
Publisher:
W. H. Freeman