Key Question: Is there a relationship between the spaces from GO and ho Part 1: Create a scatter plot that compares the number of spaces a proper Make sure you label the x-axis and y-axis. The x-axis represents The y-axis represents Part 2: Plot the data points on the graph from the chart with the propert Part 3: Answer the following questions: Describe the correlation between the "spaces from GO" and the between the spaces from GO and how much the property costs Does this correlation make sense? Explain. Are there any points, which do not seen to fit the trend and se Part 4: In order to show the trend more clearly, we can draw on the gr line of best fit on your graph that best fits the points. Explain how you
Key Question: Is there a relationship between the spaces from GO and ho Part 1: Create a scatter plot that compares the number of spaces a proper Make sure you label the x-axis and y-axis. The x-axis represents The y-axis represents Part 2: Plot the data points on the graph from the chart with the propert Part 3: Answer the following questions: Describe the correlation between the "spaces from GO" and the between the spaces from GO and how much the property costs Does this correlation make sense? Explain. Are there any points, which do not seen to fit the trend and se Part 4: In order to show the trend more clearly, we can draw on the gr line of best fit on your graph that best fits the points. Explain how you

Elementary Geometry For College Students, 7e
7th Edition
ISBN:9781337614085
Author:Alexander, Daniel C.; Koeberlein, Geralyn M.
Publisher:Alexander, Daniel C.; Koeberlein, Geralyn M.
ChapterP: Preliminary Concepts
SectionP.CT: Test
Problem 1CT

Related questions
Question

Transcribed Image Text:One way of displaying this information is to plot a scatter plot. It clearly shows any patters or trends in the data and
helps you describe the relationship between two variables.
Create a scatter plot from the following set of data. Be sure to include answer all the questions.
Key Question: Is there a relationship between the spaces from GO and how much the property costs?
Part 1: Create a scatter plot that compares the number of spaces a property is from Go and the cost for that property.
Make sure you label the x-axis and y-axis.
The x-axis represents
The y-axis represents
Part 2: Plot the data points on the graph from the chart with the property price data from the Monopoly game.
Part 3: Answer the following questions:
Describe the correlation between the "spaces from GO" and the "Cost of the Property." Is there a relationship
between the spaces from G0 and how much the property costs?
Does this correlation make sense? Explain.
Are there any points, which do not seen to fit the trend and seem to be outliers?
Part 4: In order to show the trend more clearly, we can draw on the graph, a "Line of Best Fit" or "Trend Line". Draw a
line of best fit on your graph that best fits the points. Explain how you decided to place the line of best fit.
Part 5: Use the Line of Best to estimate and predict the following:
On the graph, put a property 23 spaces away from GO, how much do you think it should cost?
What if two new properties were added to a new version of the game and are placed at the 34th and 37th spaces
on the board. Estimate and plot this on your graph according to your line?
They have also added a new America Avenue, which costs $130 for landing on it. Estimate and plot this on your
and
graph. How many spaces from GO is it?
They have also added a new Liberty Avenue, which costs $290 for landing on it. Estimate and plot this on your
graph. How many spaces from GO is it?

Transcribed Image Text:Property
Mediterranean Avenue
Spaces from GO (x)
2
Cost of Property (y).
$60
Baltic Avenue
4
$60
$200
$100
$100
$120
Reading Railroad
Oriental Avenue
Vermont Avenue
9.
Connecticut Avenue
19
St. Charles Place
12
$140
Electric Company
$150
$140
$160
$200
$180
$180
$200
13
States Avenue
14
Virginia Avenue
Pennsylvania Railroad
St. James Place
15
16
17
Tennessee Avenue
19
New York Avenue
20
Kentucky Avenue
Indiana Avenue
$220
$220
22
24
$240
$200
$260
Illinois Avenue
25
B &O Railroad
26
Atlantic Avenue
27
$260
$150
$280
$300
28
Ventnor Avenue
29
Water Works
30
Marvin Gardens
32
Pacific Avenue
$320
$200
$200
$350
33
North Carolina Avenue
Pennsylvania Avenue
Short Line Railroad
35
36
38
Park Place
$400
40
Boardwalk
Expert Solution
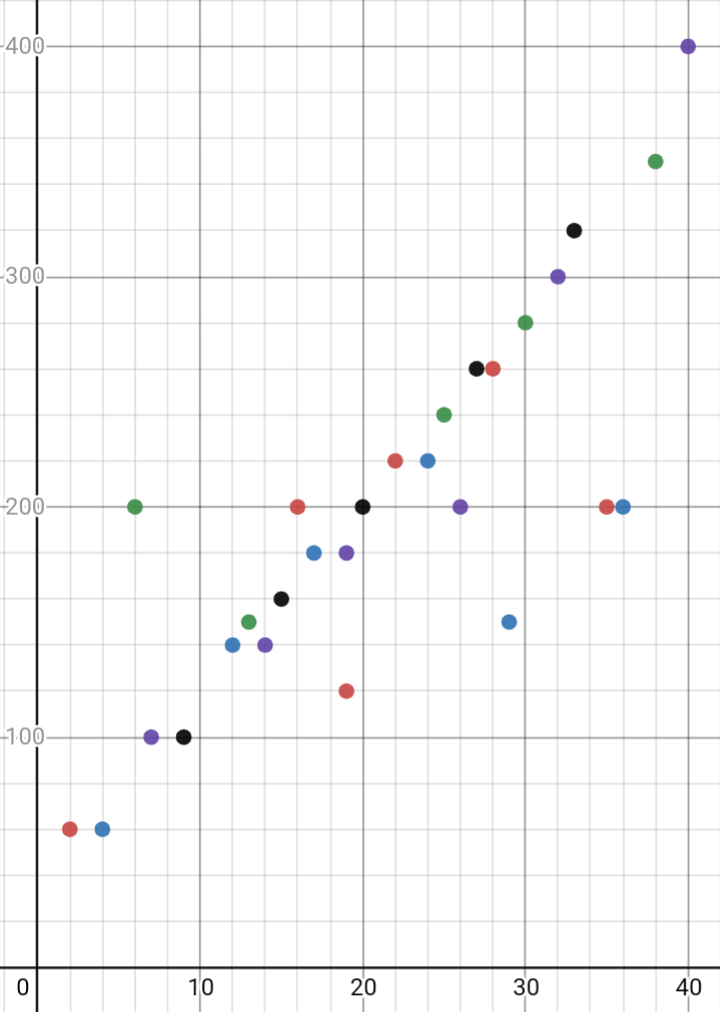
Step 1
From the given points the scatter plot is given by,

Trending now
This is a popular solution!

Step by step
Solved in 3 steps with 2 images

Recommended textbooks for you
Elementary Geometry For College Students, 7e
Geometry
ISBN:
9781337614085
Author:
Alexander, Daniel C.; Koeberlein, Geralyn M.
Publisher:
Cengage,

Elementary Geometry for College Students
Geometry
ISBN:
9781285195698
Author:
Daniel C. Alexander, Geralyn M. Koeberlein
Publisher:
Cengage Learning
Elementary Geometry For College Students, 7e
Geometry
ISBN:
9781337614085
Author:
Alexander, Daniel C.; Koeberlein, Geralyn M.
Publisher:
Cengage,
Elementary Geometry for College Students
Geometry
ISBN:
9781285195698
Author:
Daniel C. Alexander, Geralyn M. Koeberlein
Publisher:
Cengage Learning