k x (t) a b t

Advanced Engineering Mathematics
10th Edition
ISBN:9780470458365
Author:Erwin Kreyszig
Publisher:Erwin Kreyszig
Chapter2: Second-order Linear Odes
Section: Chapter Questions
Problem 1RQ

Related questions
Question
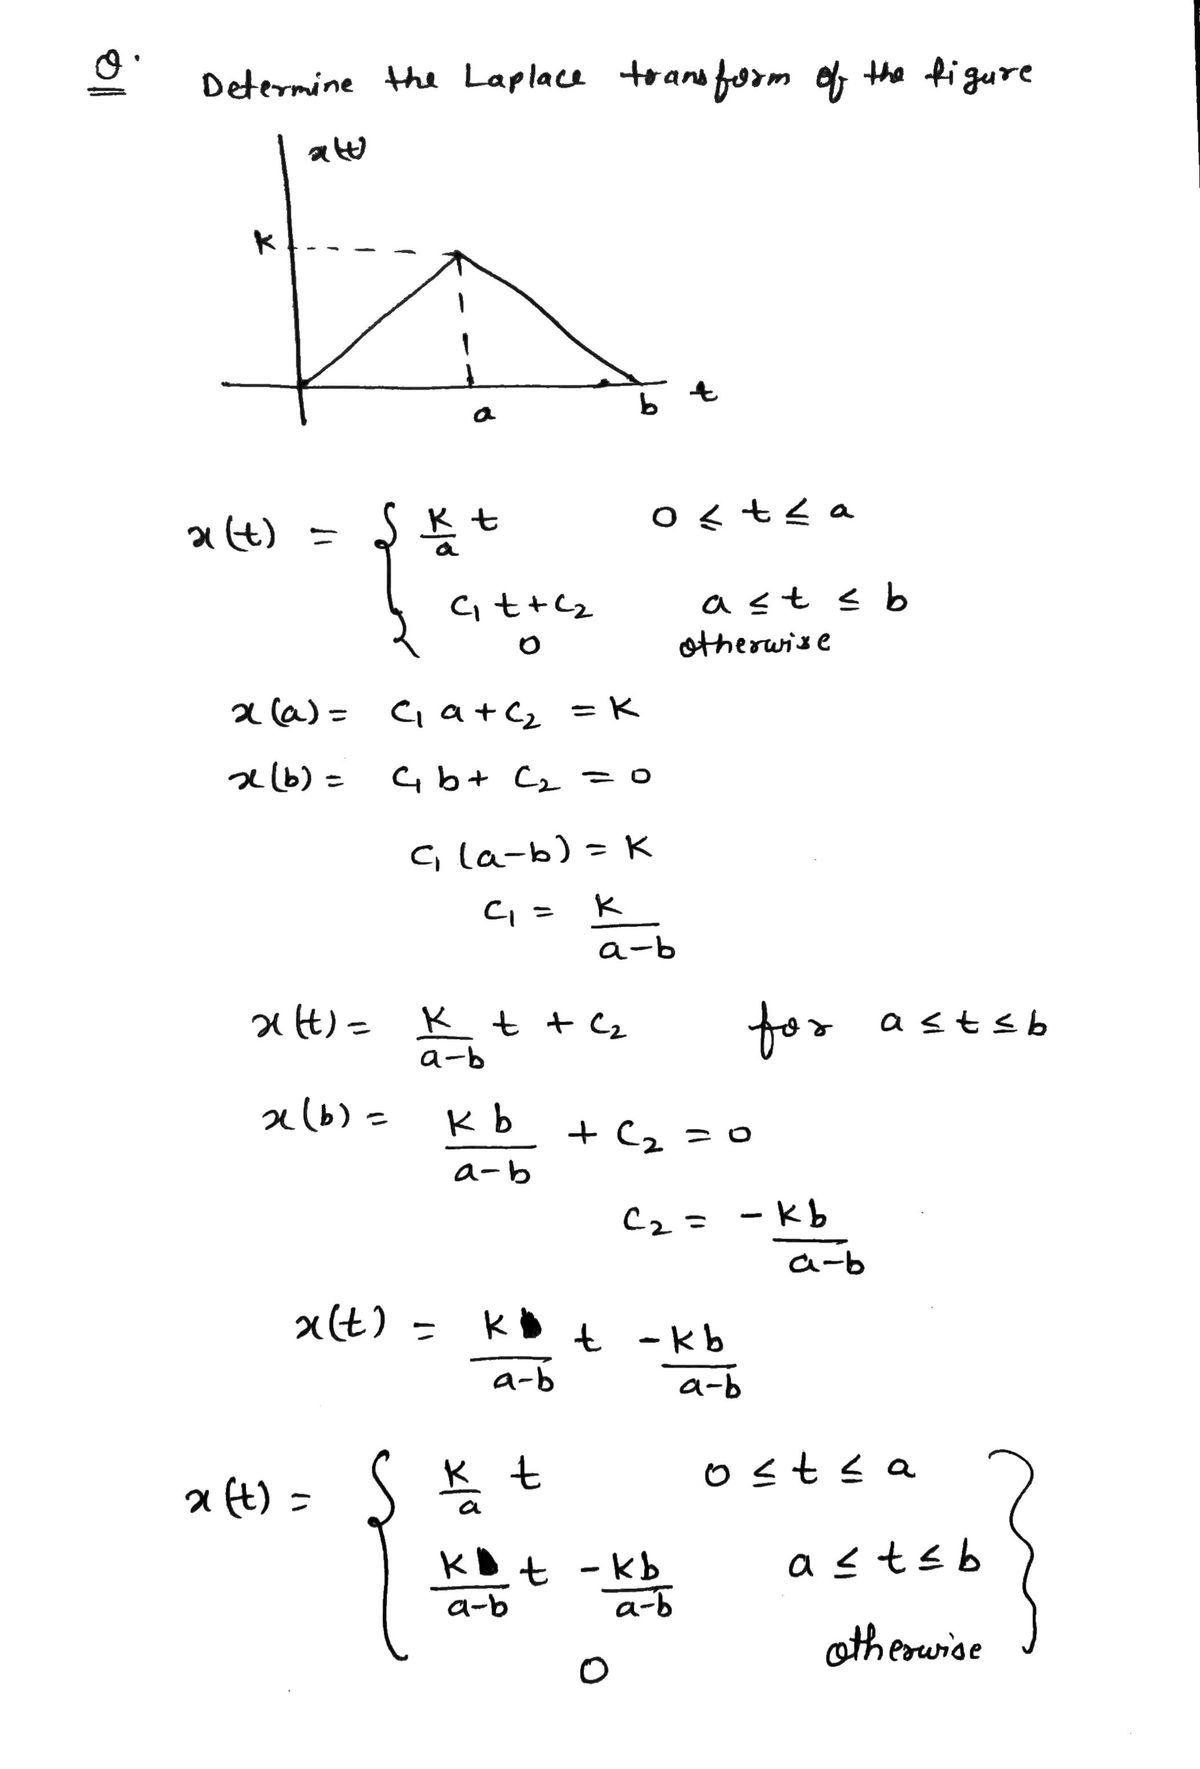
Determine the laplace transform of the figure shown below with a, b, and k as constraints.

Transcribed Image Text:The diagram is a graph representing a piecewise linear function \( x(t) \) with respect to \( t \).
- The horizontal axis is labeled as \( t \).
- The vertical axis is labeled as \( x(t) \).
Key Features:
1. **Graph Shape**: The graph is a symmetrical triangle.
- It starts from the origin point (0,0).
- It rises linearly to a peak point at \( (a, k) \).
- It then decreases linearly back to the horizontal axis at point \( (b, 0) \).
2. **Points**:
- The peak of the triangle is at time \( t = a \) and value \( x(t) = k \).
- The base of the triangle runs from \( t = 0 \) to \( t = b \).
3. **Dashed Lines**:
- A horizontal dashed line extends from the peak at \( (a, k) \) to the vertical axis, indicating the maximum value \( k \).
- A vertical dashed line drops from the peak at \( (a, k) \) to the horizontal axis, indicating the time \( t = a \).
This type of graph is often used to represent a time-dependent process that grows to a certain level and then declines symmetrically, similar to a triangle wave.
Expert Solution
Step 1

Step by step
Solved in 2 steps with 2 images

Recommended textbooks for you
Advanced Engineering Mathematics
Advanced Math
ISBN:
9780470458365
Author:
Erwin Kreyszig
Publisher:
Wiley, John & Sons, Incorporated

Numerical Methods for Engineers
Advanced Math
ISBN:
9780073397924
Author:
Steven C. Chapra Dr., Raymond P. Canale
Publisher:
McGraw-Hill Education

Introductory Mathematics for Engineering Applicat…
Advanced Math
ISBN:
9781118141809
Author:
Nathan Klingbeil
Publisher:
WILEY
Advanced Engineering Mathematics
Advanced Math
ISBN:
9780470458365
Author:
Erwin Kreyszig
Publisher:
Wiley, John & Sons, Incorporated
Numerical Methods for Engineers
Advanced Math
ISBN:
9780073397924
Author:
Steven C. Chapra Dr., Raymond P. Canale
Publisher:
McGraw-Hill Education
Introductory Mathematics for Engineering Applicat…
Advanced Math
ISBN:
9781118141809
Author:
Nathan Klingbeil
Publisher:
WILEY

Mathematics For Machine Technology
Advanced Math
ISBN:
9781337798310
Author:
Peterson, John.
Publisher:
Cengage Learning,

