It was observed that 4 out of 10 randomly selected students went to the cinema. Find the 95% confidence interval estimate for the proportion of moviegoers in the population, \pi. P( 0,20 <1< 0,30 ) = 0,95 OA) P( 0,30
It was observed that 4 out of 10 randomly selected students went to the cinema. Find the 95% confidence interval estimate for the proportion of moviegoers in the population, \pi. P( 0,20 <1< 0,30 ) = 0,95 OA) P( 0,30

A First Course in Probability (10th Edition)
10th Edition
ISBN:9780134753119
Author:Sheldon Ross
Publisher:Sheldon Ross
Chapter1: Combinatorial Analysis
Section: Chapter Questions
Problem 1.1P: a. How many different 7-place license plates are possible if the first 2 places are for letters and...

Related questions

Question

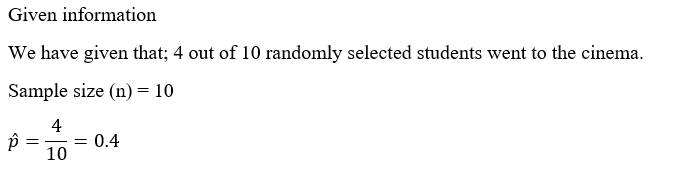
Transcribed Image Text:It was observed that 4 out of 10 randomly selected students went to the cinema. Find the 95% confidence interval estimate for the
1 -
proportion of moviegoers in the population, \pi.
P( 0,20 <T <0,30 ) = 0,95
A)
P( 0,30 <T< 0,50 )= 0,95
B)
P( 0,60 <n<0,75 )= 0,95
C)
P( 0,10 <T< 0,25 ) = 0,95
D)
P( 0,30 <T<0,50 ) = 0,05
O E)
Expert Solution
Step 1

Step by step
Solved in 2 steps with 2 images

Knowledge Booster


Learn more about
Need a deep-dive on the concept behind this application? Look no further. Learn more about this topic, probability and related others by exploring similar questions and additional content below.Recommended textbooks for you
A First Course in Probability (10th Edition)
Probability
ISBN:
9780134753119
Author:
Sheldon Ross
Publisher:
PEARSON

A First Course in Probability (10th Edition)
Probability
ISBN:
9780134753119
Author:
Sheldon Ross
Publisher:
PEARSON