iSuppose the researcher changes the sample size to 100. How does it affect P-value? (In this case, we assume that the sample mean and population standard deviation are not changed). Is it larger, smaller or not changed? On what grounds? (You may find numbers, but I would rather recommend you to use the concepts of process, i.e. irelationship between sample size, test-stat and P-value.) The researcher feels that the confidence interval for u is t0o wide. So the researcher wonders how to increase of precision by decreasing the size of the confidenceinterval for u. If the researcher can control only its sample size, what should be the researcher's choice? How does it work? Explain. Before the test, the researcher did not check the distribution of the sample data. Actually, its distribution is like the boxplot shown below. Based on the distribution of sample scores, explain whether or not you will retain your previous conclusion.
iSuppose the researcher changes the sample size to 100. How does it affect P-value? (In this case, we assume that the sample mean and population standard deviation are not changed). Is it larger, smaller or not changed? On what grounds? (You may find numbers, but I would rather recommend you to use the concepts of process, i.e. irelationship between sample size, test-stat and P-value.) The researcher feels that the confidence interval for u is t0o wide. So the researcher wonders how to increase of precision by decreasing the size of the confidenceinterval for u. If the researcher can control only its sample size, what should be the researcher's choice? How does it work? Explain. Before the test, the researcher did not check the distribution of the sample data. Actually, its distribution is like the boxplot shown below. Based on the distribution of sample scores, explain whether or not you will retain your previous conclusion.

MATLAB: An Introduction with Applications
6th Edition
ISBN:9781119256830
Author:Amos Gilat
Publisher:Amos Gilat
Chapter1: Starting With Matlab
Section: Chapter Questions
Problem 1P

Related questions
Question
need help with these making sure I am doing this correctly

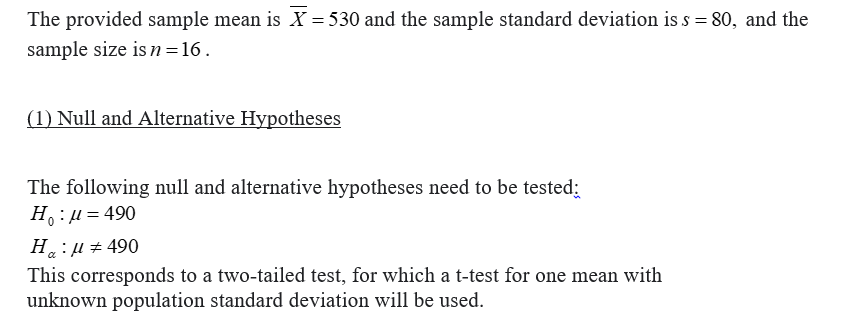
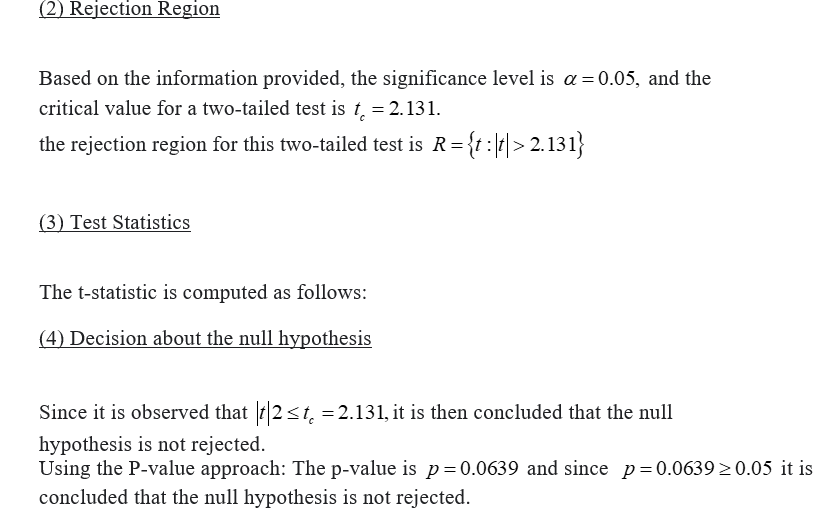
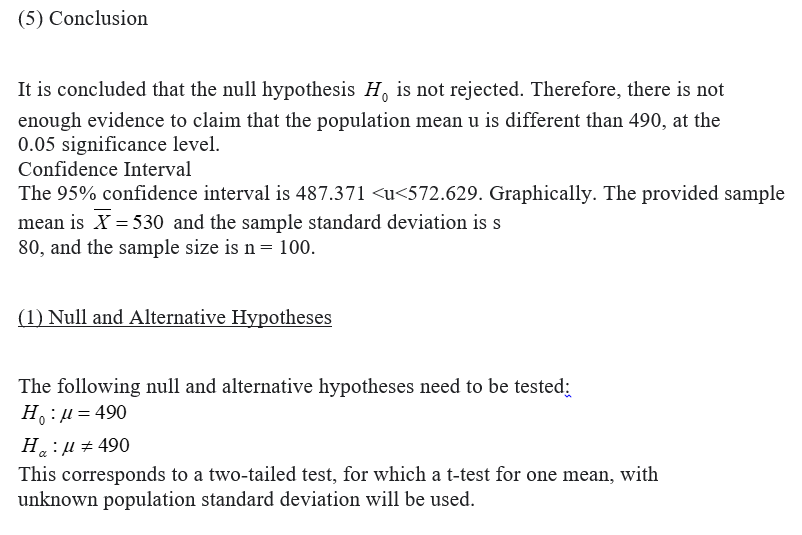
Transcribed Image Text:iSuppose the researcher changes the sample size to 100. How does it affect P-value? (In this case, we assume that
the sample mean and population standard deviation are not changed). Is it larger, smaller or not changed? On
what grounds? (You may find numbers, but I would rather recommend you to use the concepts of process, i.e.
irelationship between sample size, test-stat and P-value.)
The researcher feels that the confidence interval for u is t0o wide. So the researcher wonders how to increase of
precision by decreasing the size of the confidenceinterval for u. If the researcher can control only its sample size,
what should be the researcher's choice? How does it work? Explain.
Before the test, the researcher did not check the distribution of the sample data. Actually, its distribution is like
the boxplot shown below. Based on the distribution of sample scores, explain whether or not you will retain
your previous conclusion.

Expert Solution
Step 1
Step 2
Step 3

Step by step
Solved in 5 steps with 5 images

Knowledge Booster


Learn more about
Need a deep-dive on the concept behind this application? Look no further. Learn more about this topic, statistics and related others by exploring similar questions and additional content below.Recommended textbooks for you
MATLAB: An Introduction with Applications
Statistics
ISBN:
9781119256830
Author:
Amos Gilat
Publisher:
John Wiley & Sons Inc

Probability and Statistics for Engineering and th…
Statistics
ISBN:
9781305251809
Author:
Jay L. Devore
Publisher:
Cengage Learning

Statistics for The Behavioral Sciences (MindTap C…
Statistics
ISBN:
9781305504912
Author:
Frederick J Gravetter, Larry B. Wallnau
Publisher:
Cengage Learning
MATLAB: An Introduction with Applications
Statistics
ISBN:
9781119256830
Author:
Amos Gilat
Publisher:
John Wiley & Sons Inc
Probability and Statistics for Engineering and th…
Statistics
ISBN:
9781305251809
Author:
Jay L. Devore
Publisher:
Cengage Learning
Statistics for The Behavioral Sciences (MindTap C…
Statistics
ISBN:
9781305504912
Author:
Frederick J Gravetter, Larry B. Wallnau
Publisher:
Cengage Learning

Elementary Statistics: Picturing the World (7th E…
Statistics
ISBN:
9780134683416
Author:
Ron Larson, Betsy Farber
Publisher:
PEARSON

The Basic Practice of Statistics
Statistics
ISBN:
9781319042578
Author:
David S. Moore, William I. Notz, Michael A. Fligner
Publisher:
W. H. Freeman

Introduction to the Practice of Statistics
Statistics
ISBN:
9781319013387
Author:
David S. Moore, George P. McCabe, Bruce A. Craig
Publisher:
W. H. Freeman