Is this methoxybenzoic or methylbenzoic? Someone else said it was methoxybenzoic because the single peak wasn't present for a methyl group but looks like to me that it is. Are there other differences? Including the IR and HNMR spectrums.

Chemistry
10th Edition
ISBN:9781305957404
Author:Steven S. Zumdahl, Susan A. Zumdahl, Donald J. DeCoste
Publisher:Steven S. Zumdahl, Susan A. Zumdahl, Donald J. DeCoste
Chapter1: Chemical Foundations
Section: Chapter Questions
Problem 1RQ: Define and explain the differences between the following terms. a. law and theory b. theory and...
icon
Related questions
Question
100%

Is this methoxybenzoic or methylbenzoic? Someone else said it was methoxybenzoic  because the single peak wasn't present for a methyl group but looks like to me that it is. Are there other differences? Including the IR and HNMR spectrums. 

This image appears to show an NMR (Nuclear Magnetic Resonance) spectrum, which is used to determine the structure of organic compounds. Here are the details:

### Graph Description:
- **X-Axis:** Represents the chemical shift in parts per million (ppm), ranging from approximately 0 to 9 ppm.
- **Y-Axis:** Represents the intensity or signal strength of the peaks.
- **Peaks:** The spectrum displays distinct peaks at various chemical shifts, indicating the presence of different hydrogen environments within the molecule.

### Peak Details (From Table):
- **Index 1:** 
  - **Frequency:** 2442.2 
  - **PPM:** 8.082
  - **Height:** 8.7

- **Index 2:** 
  - **Frequency:** 2416.0 
  - **PPM:** 8.055
  - **Height:** 9.5

- **Index 3:** 
  - **Frequency:** 2411.9 
  - **PPM:** 8.051
  - **Height:** 9.6

- **Index 4:** 
  - **Frequency:** 2180.7 
  - **PPM:** 7.270
  - **Height:** 104.4

- **Index 5:** 
  - **Frequency:** 2092.1 
  - **PPM:** 6.975
  - **Height:** 10.4

- **Index 6:** 
  - **Frequency:** 2083.3 
  - **PPM:** 6.945
  - **Height:** 9.3

- **Index 7:** 
  - **Frequency:** 1168.3 
  - **PPM:** 3.995
  - **Height:** 37.4

- **Index 8:** 
  - **Frequency:** 1167.2 
  - **PPM:** 3.891
  - **Height:** 42.4

### Understanding the Spectrum:
- **High PPM Values:** Peaks at higher ppm values (e.g., around 8 ppm) are typically indicative of hydrogen atoms in aromatic environments.
- **Peak Height and Intensity:** The height of the peaks relates to the number of hydrogen atoms contributing to that signal.
- **Chemical Shifts:** Each peak's position on the ppm scale
Transcribed Image Text:This image appears to show an NMR (Nuclear Magnetic Resonance) spectrum, which is used to determine the structure of organic compounds. Here are the details: ### Graph Description: - **X-Axis:** Represents the chemical shift in parts per million (ppm), ranging from approximately 0 to 9 ppm. - **Y-Axis:** Represents the intensity or signal strength of the peaks. - **Peaks:** The spectrum displays distinct peaks at various chemical shifts, indicating the presence of different hydrogen environments within the molecule. ### Peak Details (From Table): - **Index 1:** - **Frequency:** 2442.2 - **PPM:** 8.082 - **Height:** 8.7 - **Index 2:** - **Frequency:** 2416.0 - **PPM:** 8.055 - **Height:** 9.5 - **Index 3:** - **Frequency:** 2411.9 - **PPM:** 8.051 - **Height:** 9.6 - **Index 4:** - **Frequency:** 2180.7 - **PPM:** 7.270 - **Height:** 104.4 - **Index 5:** - **Frequency:** 2092.1 - **PPM:** 6.975 - **Height:** 10.4 - **Index 6:** - **Frequency:** 2083.3 - **PPM:** 6.945 - **Height:** 9.3 - **Index 7:** - **Frequency:** 1168.3 - **PPM:** 3.995 - **Height:** 37.4 - **Index 8:** - **Frequency:** 1167.2 - **PPM:** 3.891 - **Height:** 42.4 ### Understanding the Spectrum: - **High PPM Values:** Peaks at higher ppm values (e.g., around 8 ppm) are typically indicative of hydrogen atoms in aromatic environments. - **Peak Height and Intensity:** The height of the peaks relates to the number of hydrogen atoms contributing to that signal. - **Chemical Shifts:** Each peak's position on the ppm scale
This is an infrared (IR) spectrum graph, commonly used to identify organic compounds by showing how different wavelengths of infrared light are absorbed by the material.

**Graph Details:**

- **Y-Axis (%T):** Represents the percentage of transmittance, which indicates how much light passes through the sample. Lower transmittance values indicate regions where more light is absorbed.
  
- **X-Axis (cm⁻¹):** Displays the wavenumber, representing the frequency of infrared light absorbed by the sample, measured in inverse centimeters. The range in this spectrum is 4000 to 650 cm⁻¹.

**Peaks:**

The spectrum features several peaks corresponding to different bond vibrations in the material:

- **2842.94 cm⁻¹ and 2546.11 cm⁻¹:** Possible C-H stretching vibrations in alkanes or aldehydes.
- **1922.94 cm⁻¹:** Could be associated with carbonyl groups (C=O).
- **1602.05 cm⁻¹, 1577.53 cm⁻¹:** Likely indicating aromatic ring vibrations or double bond stretches.
- **1324.45 cm⁻¹, 1427.10 cm⁻¹:** N-O stretching vibrations in nitro compounds or C-H bending.
- **1105.88 cm⁻¹, 1025.22 cm⁻¹:** Indicative of C-O stretching in alcohols or ethers.
- **697.08 cm⁻¹:** May represent out-of-plane bending in aromatic compounds.

These peaks help identify functional groups present in the compound being analyzed. Each peak corresponds to a specific bond, and its exact position can help determine the molecular structure.
Transcribed Image Text:This is an infrared (IR) spectrum graph, commonly used to identify organic compounds by showing how different wavelengths of infrared light are absorbed by the material. **Graph Details:** - **Y-Axis (%T):** Represents the percentage of transmittance, which indicates how much light passes through the sample. Lower transmittance values indicate regions where more light is absorbed. - **X-Axis (cm⁻¹):** Displays the wavenumber, representing the frequency of infrared light absorbed by the sample, measured in inverse centimeters. The range in this spectrum is 4000 to 650 cm⁻¹. **Peaks:** The spectrum features several peaks corresponding to different bond vibrations in the material: - **2842.94 cm⁻¹ and 2546.11 cm⁻¹:** Possible C-H stretching vibrations in alkanes or aldehydes. - **1922.94 cm⁻¹:** Could be associated with carbonyl groups (C=O). - **1602.05 cm⁻¹, 1577.53 cm⁻¹:** Likely indicating aromatic ring vibrations or double bond stretches. - **1324.45 cm⁻¹, 1427.10 cm⁻¹:** N-O stretching vibrations in nitro compounds or C-H bending. - **1105.88 cm⁻¹, 1025.22 cm⁻¹:** Indicative of C-O stretching in alcohols or ethers. - **697.08 cm⁻¹:** May represent out-of-plane bending in aromatic compounds. These peaks help identify functional groups present in the compound being analyzed. Each peak corresponds to a specific bond, and its exact position can help determine the molecular structure.
Expert Solution
Step 1

First, let's understand all the peaks that can be obtained from both compounds.

Methylbenzoic acid:

Here, para-methyl benzoic acid is considered for demonstration purposes.

All the chemically different protons in this compound are shown below:

Chemistry homework question answer, step 1, image 1

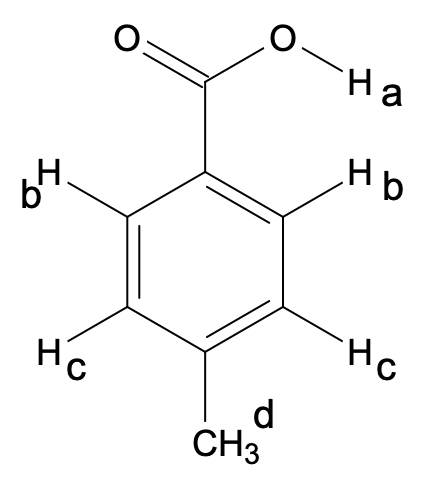
Thus, there are 4 types of different protons (a, b, c, d) which will lead to 4 1H-NMR signals.

Methoxybenzoic acid:

Again, the para compound has been taken into consideration for demonstration purposes.

Chemistry homework question answer, step 1, image 2

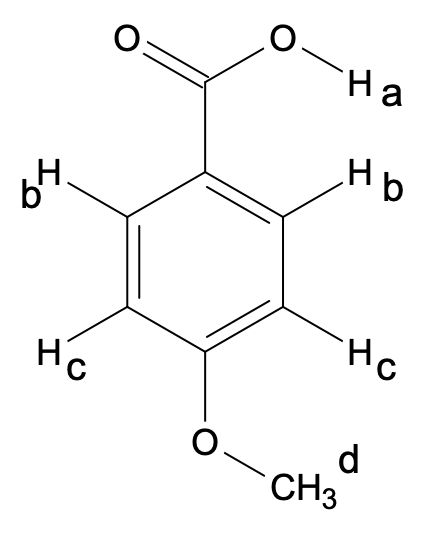
Here also, 4 types of chemically non-equivalent protons are there that will give rise to 4 NMR signals.

trending now

Trending now

This is a popular solution!

steps

Step by step

Solved in 2 steps with 2 images

Blurred answer
Knowledge Booster
Mass Spectrometry
Learn more about
Need a deep-dive on the concept behind this application? Look no further. Learn more about this topic, chemistry and related others by exploring similar questions and additional content below.
Similar questions
  • SEE MORE QUESTIONS
Recommended textbooks for you
Chemistry
Chemistry
Chemistry
ISBN:
9781305957404
Author:
Steven S. Zumdahl, Susan A. Zumdahl, Donald J. DeCoste
Publisher:
Cengage Learning
Chemistry
Chemistry
Chemistry
ISBN:
9781259911156
Author:
Raymond Chang Dr., Jason Overby Professor
Publisher:
McGraw-Hill Education
Principles of Instrumental Analysis
Chemistry
ISBN:
9781305577213
Author:
Douglas A. Skoog, F. James Holler, Stanley R. Crouch
Publisher:
Cengage Learning
Organic Chemistry
Organic Chemistry
Chemistry
ISBN:
9780078021558
Author:
Janice Gorzynski Smith Dr.
Publisher:
McGraw-Hill Education
Chemistry: Principles and Reactions
Chemistry
ISBN:
9781305079373
Author:
William L. Masterton, Cecile N. Hurley
Publisher:
Cengage Learning
Elementary Principles of Chemical Processes, Bind…
Chemistry
ISBN:
9781118431221
Author:
Richard M. Felder, Ronald W. Rousseau, Lisa G. Bullard
Publisher:
WILEY