Is there a significant difference between the pretest and posttest? Yes, p < .05 O Yes, p< .01 O Yes, p< .001 O Yes, p< .000 O Yes, p < .0005 Yes, p< .02 No, p> .05
Is there a significant difference between the pretest and posttest? Yes, p < .05 O Yes, p< .01 O Yes, p< .001 O Yes, p< .000 O Yes, p < .0005 Yes, p< .02 No, p> .05

MATLAB: An Introduction with Applications
6th Edition
ISBN:9781119256830
Author:Amos Gilat
Publisher:Amos Gilat
Chapter1: Starting With Matlab
Section: Chapter Questions
Problem 1P

Related questions
Question

Transcribed Image Text:### Paired Samples Analysis Report
This report details the analysis of paired samples grouped into "Beginning of Semester" and "End of Semester."
#### Paired Samples Statistics
- **Pair 1:**
- **Beginning of Semester**
- Mean: 73.75
- N (Sample size): 12
- Standard Deviation: 21.996
- Standard Error Mean: 6.350
- **End of Semester**
- Mean: 81.92
- N (Sample size): 12
- Standard Deviation: 18.273
- Standard Error Mean: 5.275
#### Paired Samples Correlations
- **Correlation for Pair 1 (Beginning vs End of Semester):**
- N (Sample size): 12
- Correlation coefficient: .892
- Significance (One-Sided p): < .001
- Significance (Two-Sided p): < .001
#### Paired Samples Test
- **Paired Differences for Pair 1 (Beginning vs End of Semester):**
- Mean Difference: -8.167
- Standard Deviation of Difference: 10.035
- Standard Error Mean of Difference: 2.897
- 95% Confidence Interval of the Difference:
- Lower: -14.542
- Upper: -1.791
- t-value: -2.819
- Degrees of Freedom (df): 11
- Significance (One-Sided p): .008
- Significance (Two-Sided p): .017
#### Paired Samples Effect Sizes
- **Effect Size for Pair 1 (Beginning vs End of Semester):**
- **Cohen's d:**
- Standardizer: 10.035
- Point Estimate: -.814
- 95% Confidence Interval:
- Lower: -1.458
- Upper: -.142
- **Hedges' correction:**
- Standardizer: 10.394
- Point Estimate: -.786
- 95% Confidence Interval:
- Lower: -1.408
- Upper: -.137
**Note:**
- The denominator used for estimating effect sizes is explained as follows:
- **Cohen's d** uses the sample standard deviation of the mean difference

Transcribed Image Text:Title: Analyzing Statistical Significance in Pretest and Posttest Results
**Question:** Is there a significant difference between the pretest and posttest?
- Yes, \( p < .05 \)
- Yes, \( p < .01 \)
- Yes, \( p < .001 \)
- Yes, \( p < .000 \)
- Yes, \( p < .0005 \)
- Yes, \( p < .02 \)
- No, \( p > .05 \)
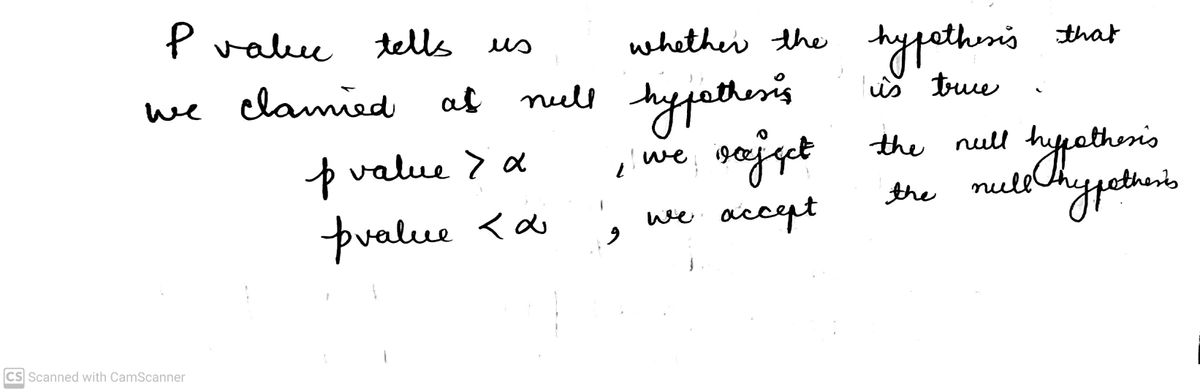
**Explanation:**
This questionnaire is designed to help learners understand the concept of statistical significance in the context of comparing pretest and posttest results. Statistical significance is often determined by the p-value. Here are some guidelines based on p-values:
- **\( p < .05 \):** Typically considered the threshold for statistical significance in many fields. If the p-value is less than .05, it suggests that there is less than a 5% probability that the observed difference is due to random chance, indicating a significant difference.
- **\( p < .01 \) and \( p < .001 \):** These thresholds indicate even stronger evidence against the null hypothesis, suggesting more robust significance.
- **\( p < .000 \) and \( p < .0005 \):** These reflect extremely strong evidence, suggesting the highest level of significance.
- **\( p < .02 \):** A slightly more rigorous standard than .05, indicating significance.
- **\( p > .05 \):** Suggests that the difference is not statistically significant, meaning any observed difference could likely be due to chance.
Understanding these thresholds helps in evaluating the effectiveness of an intervention or experiment by comparing initial and final assessments.
Expert Solution
Step 1

Step by step
Solved in 2 steps with 2 images

Recommended textbooks for you
MATLAB: An Introduction with Applications
Statistics
ISBN:
9781119256830
Author:
Amos Gilat
Publisher:
John Wiley & Sons Inc

Probability and Statistics for Engineering and th…
Statistics
ISBN:
9781305251809
Author:
Jay L. Devore
Publisher:
Cengage Learning

Statistics for The Behavioral Sciences (MindTap C…
Statistics
ISBN:
9781305504912
Author:
Frederick J Gravetter, Larry B. Wallnau
Publisher:
Cengage Learning
MATLAB: An Introduction with Applications
Statistics
ISBN:
9781119256830
Author:
Amos Gilat
Publisher:
John Wiley & Sons Inc
Probability and Statistics for Engineering and th…
Statistics
ISBN:
9781305251809
Author:
Jay L. Devore
Publisher:
Cengage Learning
Statistics for The Behavioral Sciences (MindTap C…
Statistics
ISBN:
9781305504912
Author:
Frederick J Gravetter, Larry B. Wallnau
Publisher:
Cengage Learning

Elementary Statistics: Picturing the World (7th E…
Statistics
ISBN:
9780134683416
Author:
Ron Larson, Betsy Farber
Publisher:
PEARSON

The Basic Practice of Statistics
Statistics
ISBN:
9781319042578
Author:
David S. Moore, William I. Notz, Michael A. Fligner
Publisher:
W. H. Freeman

Introduction to the Practice of Statistics
Statistics
ISBN:
9781319013387
Author:
David S. Moore, George P. McCabe, Bruce A. Craig
Publisher:
W. H. Freeman