Is a statistics class' delivery type a factor in how well students do on the final exam? The table below shows the average percent on final exams from several randomly selected classes that used the different delivery types. Face-to-Face Hybrid | Online 76 99 72 65 59 96 63 71 66 82 99 99 65 73 100 65 100 85 64 94 76 75 57 Assume that all distributions are normal, the three population standard deviations are all the same, the data was collected independently and randomly. Use a level of significance of = 0.1. and Ho: µi = µ2 = µ3 H1: At least two of the means differ from each other.
Is a statistics class' delivery type a factor in how well students do on the final exam? The table below shows the average percent on final exams from several randomly selected classes that used the different delivery types. Face-to-Face Hybrid | Online 76 99 72 65 59 96 63 71 66 82 99 99 65 73 100 65 100 85 64 94 76 75 57 Assume that all distributions are normal, the three population standard deviations are all the same, the data was collected independently and randomly. Use a level of significance of = 0.1. and Ho: µi = µ2 = µ3 H1: At least two of the means differ from each other.

MATLAB: An Introduction with Applications
6th Edition
ISBN:9781119256830
Author:Amos Gilat
Publisher:Amos Gilat
Chapter1: Starting With Matlab
Section: Chapter Questions
Problem 1P

Related questions
Question

Transcribed Image Text:Is a statistics class' delivery type a factor in how well
students do on the final exam? The table below
shows the average percent on final exams from
several randomly selected classes that used the
different delivery types.
Face-to-Face
Нybrid
Online
76
99
72
65
59
96
63
71
66
82
99
99
65
73
100
65
100
85
64
94
76
75
57
Assume that all distributions are normal, the three
population standard deviations are all the same, and
the data was collected independently and randomly.
Use a level of significance of a =
= 0.1.
Ho: µ1 = l2 = µ3
H1: At least two of the means differ from each
other.
1. For this study, we should use
ANOVA
2. The test-statistic for this data =
1.650
(Please show your answer to 3 decimal
places.)
3. The p-value for this sample :
0.2113 X
(Please show your answer to 4 decimal
places.)
4. The p-value is ( less than (or equal to) alpha
5. Base on this, we should
reject the null hypothesis
hypothesis
6. As such, the final conclusion is that...
O There is sufficient evidence to support
the claim that course delivery type is a
factor in final exam score.
| There is insufficient evidence to
support the claim that course delivery
type is a factor in final exam score.
Expert Solution
Step 1
1.
Since the means of more than two groups have to be compared ANOVA has to be used. Thus, ANOVA should be used for this study.
2.
The ANOVA is conducted by using EXCEL. The software procedure is given below:
- Enter the data.
- Select Data > Data Analysis >ANOVA: Single Factor> OK.
- Enter Input Range as A1:C9.
- Mark Labels in First Row.
- Enter Alpha as 0.10.
- Click OK.
The output using EXCEL is as follows:
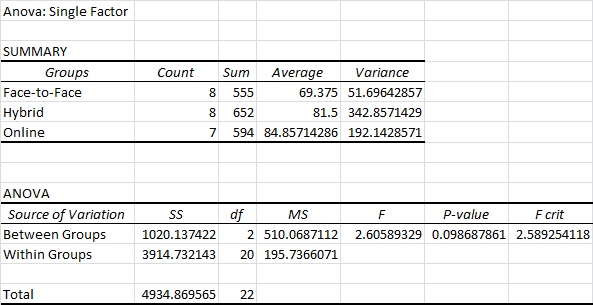
From the output, the test statistic value is 2.606.
Thus, the test statistic is 2.606.

Trending now
This is a popular solution!

Step by step
Solved in 2 steps with 1 images

Knowledge Booster


Learn more about
Need a deep-dive on the concept behind this application? Look no further. Learn more about this topic, statistics and related others by exploring similar questions and additional content below.Recommended textbooks for you
MATLAB: An Introduction with Applications
Statistics
ISBN:
9781119256830
Author:
Amos Gilat
Publisher:
John Wiley & Sons Inc

Probability and Statistics for Engineering and th…
Statistics
ISBN:
9781305251809
Author:
Jay L. Devore
Publisher:
Cengage Learning

Statistics for The Behavioral Sciences (MindTap C…
Statistics
ISBN:
9781305504912
Author:
Frederick J Gravetter, Larry B. Wallnau
Publisher:
Cengage Learning
MATLAB: An Introduction with Applications
Statistics
ISBN:
9781119256830
Author:
Amos Gilat
Publisher:
John Wiley & Sons Inc
Probability and Statistics for Engineering and th…
Statistics
ISBN:
9781305251809
Author:
Jay L. Devore
Publisher:
Cengage Learning
Statistics for The Behavioral Sciences (MindTap C…
Statistics
ISBN:
9781305504912
Author:
Frederick J Gravetter, Larry B. Wallnau
Publisher:
Cengage Learning

Elementary Statistics: Picturing the World (7th E…
Statistics
ISBN:
9780134683416
Author:
Ron Larson, Betsy Farber
Publisher:
PEARSON

The Basic Practice of Statistics
Statistics
ISBN:
9781319042578
Author:
David S. Moore, William I. Notz, Michael A. Fligner
Publisher:
W. H. Freeman

Introduction to the Practice of Statistics
Statistics
ISBN:
9781319013387
Author:
David S. Moore, George P. McCabe, Bruce A. Craig
Publisher:
W. H. Freeman