Inflation and interest rates the following table shows the average nominal interest rate on a six-month treasury bills between 1971 and 1975, which determined the nominal interest rate that the US government paid when it issued in those years. Table also shows the Inflation rate for the years 1971 to 1975. ( All rates are around it to the nearest tenth of a percent.) Complete the table by calculating the real interest rates for the years 1971 to 1975. Year 1971 1972 1973 1974 1975 Nominal interest rate ( percent) 4.5 4.5 7.2 7.9 6.1 Inflation Rate ( percent) 4.4 3.2 6.2 11.0 9.1 Real interest rate ( percent) according to the table, in which year did buyers of six-month treasury bills received the highest real return on their investment? 1971 1972 1973 1974
4. Inflation and interest rates
the following table shows the average nominal interest rate on a six-month treasury bills between 1971 and 1975, which determined the nominal interest rate that the US government paid when it issued in those years. Table also shows the Inflation rate for the years 1971 to 1975. ( All rates are around it to the nearest tenth of a percent.)
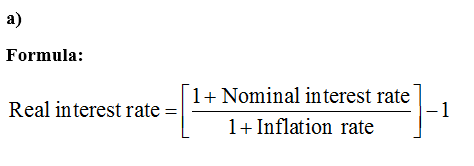
Complete the table by calculating the real interest rates for the years 1971 to 1975.
Year
1971
1972
1973
1974
1975
Nominal interest rate ( percent)
4.5
4.5
7.2
7.9
6.1
Inflation Rate ( percent)
4.4
3.2
6.2
11.0
9.1
Real interest rate ( percent)
according to the table, in which year did buyers of six-month treasury bills received the highest real
1971
1972
1973
1974
1975

Trending now
This is a popular solution!
Step by step
Solved in 4 steps with 3 images


