Independent random samples of professional football and basketball players gave the following information. Assume that the weight distributions are mound-shaped and symmetric. Weights (in Ib) of pro football players: x1; n, = 21 248 261 255 251 244 276 240 265 257 252 282 256 250 264 270 275 245 275 253 265 271 Weights (in Ib) of pro basketball players: x2; n2 = 19 205 200 220 210 192 215 223 216 228 207 225 208 195 191 207 196 181 193 201 (a) Use a calculator with mean and standard deviation keys to calculate x1, s1, ×2, and s2. (Round your answers to one decimal place.) X1 = S1 = X2 = S2 = (b) Let u, be the population mean for x1 and let u, be the population mean for x. Find a 99% confidence interval for u, - H7. (Round your answers to one decimal place.)
Independent random samples of professional football and basketball players gave the following information. Assume that the weight distributions are mound-shaped and symmetric. Weights (in Ib) of pro football players: x1; n, = 21 248 261 255 251 244 276 240 265 257 252 282 256 250 264 270 275 245 275 253 265 271 Weights (in Ib) of pro basketball players: x2; n2 = 19 205 200 220 210 192 215 223 216 228 207 225 208 195 191 207 196 181 193 201 (a) Use a calculator with mean and standard deviation keys to calculate x1, s1, ×2, and s2. (Round your answers to one decimal place.) X1 = S1 = X2 = S2 = (b) Let u, be the population mean for x1 and let u, be the population mean for x. Find a 99% confidence interval for u, - H7. (Round your answers to one decimal place.)

MATLAB: An Introduction with Applications
6th Edition
ISBN:9781119256830
Author:Amos Gilat
Publisher:Amos Gilat
Chapter1: Starting With Matlab
Section: Chapter Questions
Problem 1P

Related questions

Topic Video
Question
How could you solve this?

Transcribed Image Text:Independent random samples of professional football and basketball players gave the following information. Assume that the weight distributions are mound-shaped and symmetric.
Weights (in Ib) of pro football players: x1; n1 = 21
248 261 255 251 244 276 240 265 257 252 282
256 250 264 270 275 245 275 253 265 271
Weights (in Ib) of pro basketball players: x2; n2 = 19
205 200 220 210 192 215 223 216 228 207
225 208 195 191 207 196 181 193 201
(a) Use a calculator with mean and standard deviation keys to calculate x1, S1, X2, and s3. (Round your answers to one decimal place.)
X1 =
S1 =
X2 =
S2 =
(b) Let 41 be the population mean for x1 and let u2 be the population mean for x2. Find a 99% confidence interval for u1 - H2: (Round your answers to one decimal place.)
lower limit
upper limit
Expert Solution
Step 1
(a)
Mean and standard deviation for :
Use Ti 83 calculator to find the mean and standard deviation as follows:
- Select STAT > Edit > Enter the values of as L1.
- Click button; STAT; take the arrow to the MATH menu, and then ‘3’ numbered key.
- Click button; then ‘1’ numbered key to get L1, and close the ‘)’ bracket.
- Click Enter.
- Click button; STAT; take the arrow to the MATH menu, and then ‘7’ numbered key.
- Click button; then ‘1’ numbered key to get L1, and close the ‘)’ bracket.
- Click Enter.
Output using Ti 83 calculator is given below:
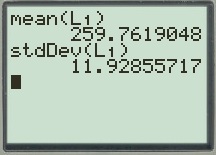
From the Ti 83 calculator output, the mean value is 259.8, and standard deviation value is 11.9.
Thus, .
Mean and standard deviation for :
Use Ti 83 calculator to find the mean and standard deviation as follows:
- Select STAT > Edit > Enter the values of as L2.
- Click button; STAT; take the arrow to the MATH menu, and then ‘3’ numbered key.
- Click button; then ‘2’ numbered key to get L2, and close the ‘)’ bracket.
- Click Enter.
- Click button; STAT; take the arrow to the MATH menu, and then ‘7’ numbered key.
- Click button; then ‘2’ numbered key to get L2, and close the ‘)’ bracket.
- Click Enter.
Output using Ti 83 calculator is given below:
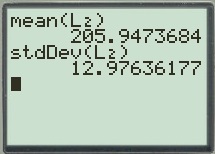
From the Ti 83 calculator output, the mean value is 205.9, and standard deviation value is 13.0.
Thus, .

Trending now
This is a popular solution!

Step by step
Solved in 2 steps with 2 images

Knowledge Booster


Learn more about
Need a deep-dive on the concept behind this application? Look no further. Learn more about this topic, statistics and related others by exploring similar questions and additional content below.Recommended textbooks for you
MATLAB: An Introduction with Applications
Statistics
ISBN:
9781119256830
Author:
Amos Gilat
Publisher:
John Wiley & Sons Inc

Probability and Statistics for Engineering and th…
Statistics
ISBN:
9781305251809
Author:
Jay L. Devore
Publisher:
Cengage Learning

Statistics for The Behavioral Sciences (MindTap C…
Statistics
ISBN:
9781305504912
Author:
Frederick J Gravetter, Larry B. Wallnau
Publisher:
Cengage Learning
MATLAB: An Introduction with Applications
Statistics
ISBN:
9781119256830
Author:
Amos Gilat
Publisher:
John Wiley & Sons Inc
Probability and Statistics for Engineering and th…
Statistics
ISBN:
9781305251809
Author:
Jay L. Devore
Publisher:
Cengage Learning
Statistics for The Behavioral Sciences (MindTap C…
Statistics
ISBN:
9781305504912
Author:
Frederick J Gravetter, Larry B. Wallnau
Publisher:
Cengage Learning

Elementary Statistics: Picturing the World (7th E…
Statistics
ISBN:
9780134683416
Author:
Ron Larson, Betsy Farber
Publisher:
PEARSON

The Basic Practice of Statistics
Statistics
ISBN:
9781319042578
Author:
David S. Moore, William I. Notz, Michael A. Fligner
Publisher:
W. H. Freeman

Introduction to the Practice of Statistics
Statistics
ISBN:
9781319013387
Author:
David S. Moore, George P. McCabe, Bruce A. Craig
Publisher:
W. H. Freeman