In Exercises 5–20, conduct the hypothesis test and provide the test statistic and the P-value and/or critical value, and state the conclusion. Police Calls The police department in Madison, Connecticut, released the following numbers of calls for the different days of the week during a February that had 28 days: Monday (114); Tuesday (152); Wednesday (160); Thursday (164); Friday (179); Saturday (196); Sunday (130). Use a 0.01 significance level to test the claim that the different days of the week have the same frequencies of police calls. Is there anything notable about the observed frequencies?


In Exercises 5–20, conduct the hypothesis test and provide the test statistic and the P-value and/or critical value, and state the conclusion.
Police Calls The police department in Madison, Connecticut, released the following numbers of calls for the different days of the week during a February that had 28 days: Monday (114); Tuesday (152); Wednesday (160); Thursday (164); Friday (179); Saturday (196); Sunday (130). Use a 0.01 significance level to test the claim that the different days of the week have the same frequencies of police calls. Is there anything notable about the observed frequencies?
There are many numbers of police calls received during the weeks of February.
The claim is that the same number of police calls had received on different weeks.
The hypotheses are given below:
Null hypothesis:
H0: pSUN=pMON= pTUE= pWED= pTHURS=pFRI=pSAT=1/7
Alternative hypothesis:
H1: At least one of the proportions is not equal to the given claim.
The test statistic is calculated by the formula,
χ2=∑(O−E)2/E
Where, O represents the observed frequency and E represents the expected frequency
Methods for finding Expected frequency:
Condition 1: If all the expected frequencies are equal, then E=nk
Condition 2: If the expected frequencies are not equal, then E=np for each category.
Where, n is the total number of frequencies, k is the categories and p is the probability of occurrence.
Here, the sample size is 1095 and there are 7 categories, sok is 7. By using the First condition, the expected frequencies are calculated as follows.
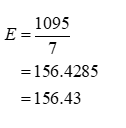
Thus, the expected frequency of 156.43 is the same for all the categories.
Chi-square test statistic:
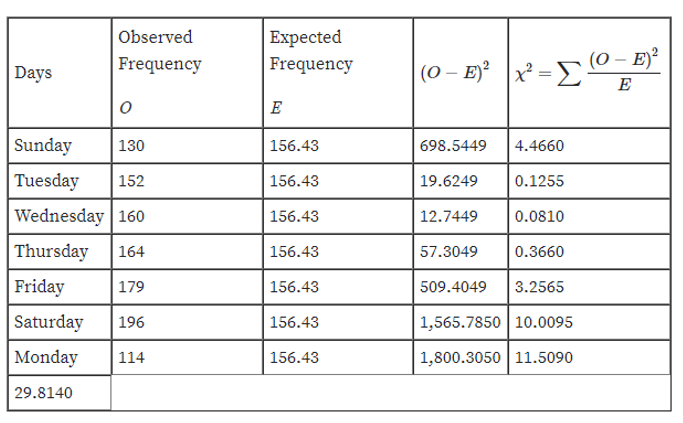
Thus, the test-statistic value is 29.8140.

Step by step
Solved in 3 steps with 2 images


