In a survey of the number of employees at medium size retailers, 160 companies were selected at randomand the following summary statistics obtained: Variable N Mean Median Tr Mean StDev SE Mean Employee 160 212.32 209.59 212.04 42.98 3.40 a) Test the hypothesis that the average number of employees is 215 against the one-sided alternative that it is less than this. Assume a 5% significance level. b) What is the power of the test if the average number of employee is actually 210?


In a survey of the number of employees at medium size retailers, 160 companies were selected at randomand the following summary statistics obtained:
| Variable | N | Tr Mean | StDev | SE Mean | ||
| Employee | 160 | 212.32 | 209.59 | 212.04 | 42.98 | 3.40 |
a) Test the hypothesis that the average number of employees is 215 against the one-sided alternative that it is less than this. Assume a 5% significance level.
b) What is the power of the test if the average number of employee is actually 210?
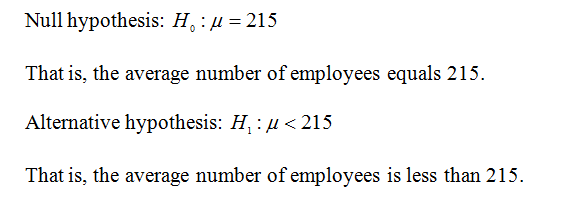
State the hypotheses.
Obtain the value of the test statistic.
The value of the test statistic is obtained below:
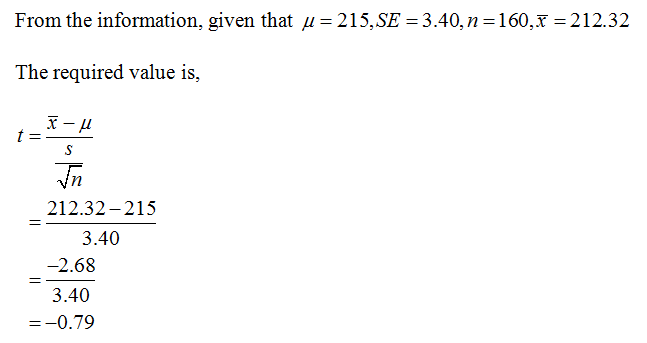
Thus, the value of the test statistic is –0.79
Obtain the degrees of degrees of freedom.
The degrees of freedom are obtained below:
From the information, given that there is a sample of 160.
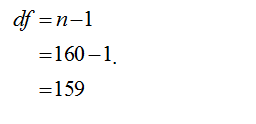
Thus, the degrees of freedom used are 159
Use Excel to obtain the probability value.
Follow the instruction to obtain the P-value:
- Open EXCEL
- Go to Formula bar.
- In formula bar enter the function as“=TDIST”
- Enter the test statistic t as ABS(–0.79).
- Enter the degrees of freedom as 159.
- Enter the tails as 1.
- Click enter
EXCEL output:
From the Excel output, the P-value is 0.2154
Thus, the P-value is 0.2154.
The conclusion is obtained as shown below:
Conclusion:
Use the level of significance is 0.05.
The p-value is greater than level of significance.

By rejection rule, do not reject the null hypothesis.
That is, the average number of employees equals 215.

Step by step
Solved in 2 steps with 7 images


