In 2003, Major League Baseball took steps to speed up the paly of baseball games and make games a more consistent duration. In a sample of 46 games in 2002, the average duration of a game was 2 hours and 58 minutes with a standard deviation of 37 minutes. A similar survey in 2003 of 54 games found that the average duration was 2 hours and 40 minutes with a standard deviation of 22 minutes. When testing the hypothesis (at the 5% level of significance) that the variance has been reduced, what is the test statistic? (please round your answer to 2 decimal places)
In 2003, Major League Baseball took steps to speed up the paly of baseball games and make games a more consistent duration. In a sample of 46 games in 2002, the average duration of a game was 2 hours and 58 minutes with a standard deviation of 37 minutes. A similar survey in 2003 of 54 games found that the average duration was 2 hours and 40 minutes with a standard deviation of 22 minutes. When testing the hypothesis (at the 5% level of significance) that the variance has been reduced, what is the test statistic? (please round your answer to 2 decimal places)

MATLAB: An Introduction with Applications
6th Edition
ISBN:9781119256830
Author:Amos Gilat
Publisher:Amos Gilat
Chapter1: Starting With Matlab
Section: Chapter Questions
Problem 1P

Related questions
Question
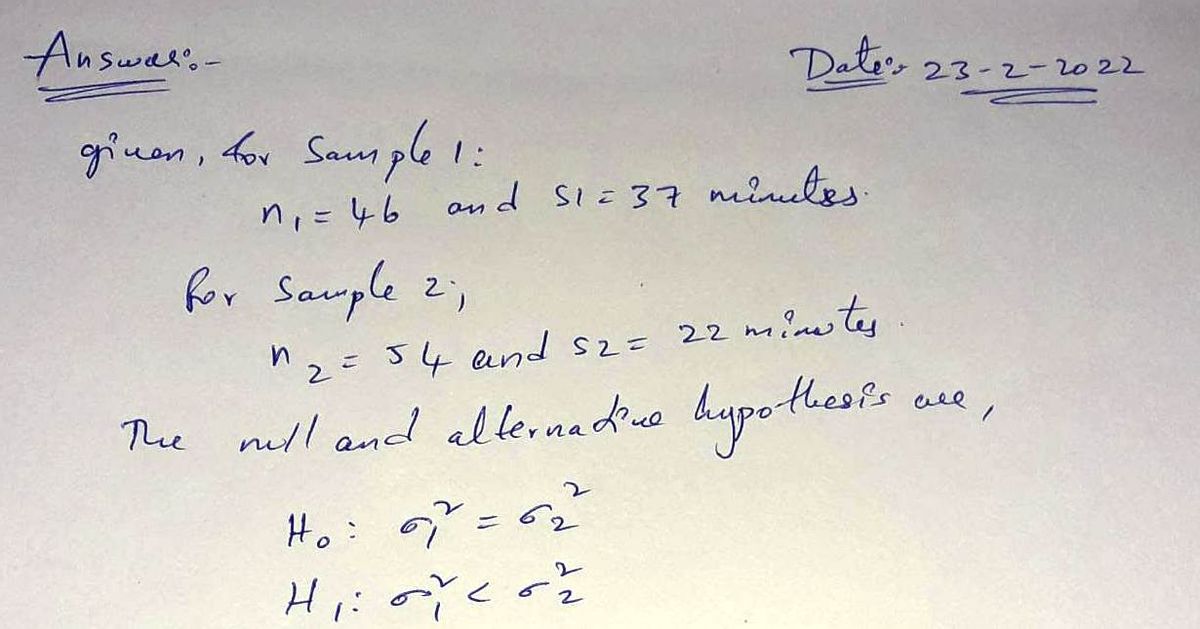
In 2003, Major League Baseball took steps to speed up the paly of baseball games and make games a more consistent duration. In a sample of 46 games in 2002, the average duration of a game was 2 hours and 58 minutes with a standard deviation of 37 minutes. A similar survey in 2003 of 54 games found that the average duration was 2 hours and 40 minutes with a standard deviation of 22 minutes. When testing the hypothesis (at the 5% level of significance) that the variance has been reduced, what is the test statistic? (please round your answer to 2 decimal places)
Expert Solution
Step 1

Trending now
This is a popular solution!

Step by step
Solved in 2 steps with 2 images

Recommended textbooks for you
MATLAB: An Introduction with Applications
Statistics
ISBN:
9781119256830
Author:
Amos Gilat
Publisher:
John Wiley & Sons Inc

Probability and Statistics for Engineering and th…
Statistics
ISBN:
9781305251809
Author:
Jay L. Devore
Publisher:
Cengage Learning

Statistics for The Behavioral Sciences (MindTap C…
Statistics
ISBN:
9781305504912
Author:
Frederick J Gravetter, Larry B. Wallnau
Publisher:
Cengage Learning
MATLAB: An Introduction with Applications
Statistics
ISBN:
9781119256830
Author:
Amos Gilat
Publisher:
John Wiley & Sons Inc
Probability and Statistics for Engineering and th…
Statistics
ISBN:
9781305251809
Author:
Jay L. Devore
Publisher:
Cengage Learning
Statistics for The Behavioral Sciences (MindTap C…
Statistics
ISBN:
9781305504912
Author:
Frederick J Gravetter, Larry B. Wallnau
Publisher:
Cengage Learning

Elementary Statistics: Picturing the World (7th E…
Statistics
ISBN:
9780134683416
Author:
Ron Larson, Betsy Farber
Publisher:
PEARSON

The Basic Practice of Statistics
Statistics
ISBN:
9781319042578
Author:
David S. Moore, William I. Notz, Michael A. Fligner
Publisher:
W. H. Freeman

Introduction to the Practice of Statistics
Statistics
ISBN:
9781319013387
Author:
David S. Moore, George P. McCabe, Bruce A. Craig
Publisher:
W. H. Freeman