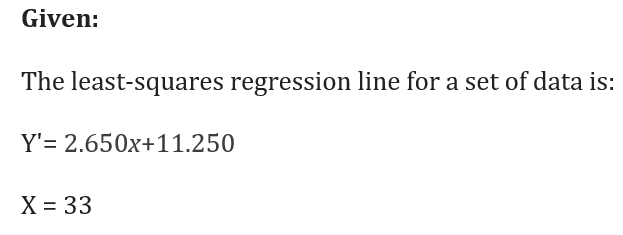
If the regresssion equation for a set of data is Y' = 2.650X+11.250 then the value of Y' for X = 33 is ?
Q: Below is some of the regression output from a regression of the amount rental houses on an island…
A: Given Area of House=3900 square foot Find How much more (or less) does a 3900 square foot house that…
Q: 8.104 Gas mileage of the Honda Civic. According to the Environmental Protection Agency (EPA) Fuel…
A: Given Information: Hypothesized value of the population mean is 36. Sample size n=50 Sample mean…
Q: Given the data as shown in the table below X Y 56 0.86 44 0.93 68 0.85 76 0.87 94 0.73
A: Consider the given dataset: X Y 56 0.86 44 0.93 68 0.85 76 0.87 94 0.73
Q: Suppose ₁ and ₂ are true mean stopping distances at 50 mph for cars of a certain type equipped with…
A: Formula to be used: The formula to calculate the confidence interval for the difference between…
Q: he line of best fit through a set of data is y=−39.338+2.368x According to this equation, what is…
A: The regression line is: y=−39.338+2.368x
Q: help pls linear regression equations of 4 calibration curves done by 4 different methods for the…
A: Given linear equations are, y=2.378x-0.005, y=1.763x-0.25, y=0.0345x+ 0.0023 and y= 0.876x+1.24. The…
Q: Suppose the linear relationship between traffic violations and auto insurance premium has SSR of…
A: given data SSR = 2825 SST = 3150
Q: It contains data on brain mass in different species versus glia-neuron ratio, the latter being a…
A: Note: Hi there! Thank you for posting the question. As your question has more than 3 parts, we have…
Q: how to Compute the slope of the OLS regression equation
A:
Q: You were asked to help with analysis of birth weights (BW) of 10,000 infants born in NYC during a…
A: This analysis aims to investigate the association between birth weights (BW) of 10,000 infants born…
Q: You were asked to help with analysis of birth weights (BW) of 10,000 infants born in NYC during a…
A: Here given that we have to perform the analysis of the birth weights (BW) of 10,000 infants born in…
Q: One set of 10 pairs of scores, X and Y values produces a correlation of r= 0.40. If SSy = 200, find…
A: From the provided information, Number of pairs (n) = 10 Correlation (r) = 0.40 SSy = 200
Q: For the following data. i_xi_fi 00 1 13 4 26 7 39 9 4 12 i) ii) 15 if data points at i=1,2,3 are…
A:
Q: The line of best fit through a set of data is y = 60.638 0.836x According to this equation, what is…
A: The general form of the regression equation is: y^=b0+b1x Here, y = predicted value of y b0 =…
Q: A correlation of r = -1 indicates that as the X-variable increases the Y-variable decreases. True or…
A: The correlation coefficient is a numerical measure of the strength of the relationship between two…
Q: This is a chart with Temperature Anomalies and Time, what does it indicate about global warming if…
A: The following simple linear regression equation has been given: y = 0.0021x + 0.0388 In general, the…
Q: y = Round to 1 decimal place.
A: Given that,The regression equation is,To find the value of the dependent variable for the given…
Q: ŷ 2.8156 +0.967rating - 0.0084size + 17.538type The estimated average tuition fees a student would…
A: To calculate the estimated average tuition fees, plug in the given values into the equation: ŷ =…
Q: 27. It doesn't matter if you answered #26 correctly. Based on all possible choices, the correlation…
A: Correlation: Strong Positive correlation: The correlation between the two variables is said to be…
Q: y' when x=3, if the equation of the regression line is y=23.1 - 3.8x
A: Given that Regression line y=23.1 - 3.8x x=3 We know general regression line Y= A+B*X Here, X=…
Q: This is a chart with Temperature Anomalies and Time, what does it indicate about global warming if…
A: The least Square regression equation is y = 0.0018x + 0.7418 Where Y is dependent variable which…
Q: It keeps saying the Y's are wrong
A:
Q: A regression line for a set of data is calculated and found to be y^=85+12x. Use this to predict…
A:
Q: 28. Joseph performs an experiment where he measures the height of several individuals and then takes…
A: Given Information: r = -0.15
Q: 55. Explain from the data given below whether A and B are independent. positively associated or…
A:
Q: Consider the following multiple regression results for estimation of demand for coffee: Dc=…
A: The multiple regression analysis is, Dc = 6.27+0.48DI - 1.23Pc - 3.5Pt + 0.19Pm + 0.07Ae. Here, Dc…
Q: what kind of charts are used in to describe HTS data
A: High-Throughput Sequencing (HTS), also known as Next-Generation Sequencing (NGS), is a powerful and…
Q: 26. What is the correlation coefficient? 97 b. 92 89
A: From the given information, x y x^2 y^2 xy 5 25 25 625 125 3 20 9 400 60 4 21 16 441 84…
Q: What is the equation of the normal line when the slope is -1/0 at point (2,8)?
A: given: the slope of the line is -1/0 at point (2,8)
Q: You were asked to help with analysis of birth weights (BW) of 10,000 infants born in NYC during a…
A: This question seeks to analyse the association between birth weights of 10,000 infants born in NYC,…
Q: A scientist is calibrating a laboratory apparatus that will be used to measure the concentration of…
A:
Q: route FT050 at Batu Pahat, Johor. Suggest how to qu the basic characteristic of this data. Then…
A: *Answer:
Q: A rosearchor is interonted in finding out the factom which detemined the yearly spending on fanily…
A:
Q: You were asked to help with analysis of birth weights (BW) of 10,000 infants born in NYC during a…
A: This question explores the relationship between the birth weights (BW) of 10,000 infants born in New…
Q: The relationship between the cost of a taxi ride (y) and the length of ride (x) is analyzed and is…
A: Hello! As you have posted more than 3 sub parts, we are answering the first 3 sub-parts. In case…
Q: For the following pairs of data points (10, 100), (8, 120), (5, 200), (4, 200), (10, 90) ( 7,110\ ,…
A: Given data: (10, 100), (8, 120), (5, 200), (4, 200), (10, 90) ( 7,110), and (6, 150). The…
Q: The line of best fit through a set of data isy=38.397+4.038xy=38.397+4.038x According to this…
A: We have given that The line of best fit through a set of data is y=38.397+4.038x.
Q: A regression was run to determine if there is a relationship between hours of TV watched per day (x)…
A: In multiple linear regression, there will be more than one independent variable. In simple linear…
Q: The line of best fit through a set of data is y = – 23.469 2.121x According to this equation, what…
A: y =-23.469-2.121x the predicted value of the dependent variable when the independent variable has…
Q: The line of best fit through a set of data is y=−40.623+2.293xy According to this equation, what…
A: The given line of best fit is a straight line that is the best approximation of the given set of…
If the regresssion equation for a set of data is Y' = 2.650X+11.250 then the value of Y' for X = 33 is ?
Step by step
Solved in 2 steps with 2 images
- Step 9 (d) What proportion of the observed variation in efficiency ratio can be attributed to the simple linear regression relationship between the two variables? The proportion of the observed variation in efficiency ratio which can be attributed to the simple linear regression relationship is equal to the coefficient of determination, r². r² = 1- SSE SST' where SSE = Syy - B₁Sxy, and SST = Syy. First, use v² = 77.1001, (v₁)² = (40.17)² = 1,613.6289, and n = 24 to calculate Sy yy' Swy = y? - = 77.1001 n Since SST = S, 1,613.6289 24 Syy, it follows that SST = Submit Skip (you cannot come back) rounded to six decimal places.Given the data as shown in the table below X Y 56 0.86 44 0.93 68 0.85 76 0.87 94 0.73 a) Using �^=-0.0034�^+1.0798 as the equation of the "Best-Fit" line. Calculate the residuals, �-�^, of this data:�1=56, �1-�^1 = −0.0292Incorrect . Round your answer to 4 decimal places.�2=44, �2-�^2 = 0.0000Incorrect . Round your answer to 4 decimal places.�3=68, �3-�^3 = 0.0016Incorrect . Round your answer to 4 decimal places.�4=76, �4-�^4 = 0.0488Incorrect . Round your answer to 4 decimal places.�5=94, �5-�^5 = −0.0300Incorrect . Round your answer to 4 decimal places.b) Using the formula��=�12+�22+⋯+��2�-2calculate the standard deviation, ��, of all residuals.��=0.0371Correct . Round your answer to 4 decimal places. Question HelpQuestion 4: Message Message instructor Submit QuestionQuestion 4The line of best fit through a set of data isy=46.539+4.023xy=46.539+4.023xAccording to this equation, what is the predicted value of the dependent variable when the independent variable has value 40?y = Round to 1 decimal place.
- Construct simple average price relative index number using geometric mean for the year 2015 for the data showing the expenditure in education of the children taking different courses. Expenditure per year 2014 2015 B.Sc 24000 26000 B.Com 20000 22000 B.E 108000 12000 M.B.B.S 150000 168000A scientist is calibrating a laboratory apparatus that will be used to measure the concentration of ozone in air samples. To check the calibration, samples of known concentration are measured. The true concentrations in ppm (x) and the measured concentrations in ppm (y) data points are: (0, 1), (10, 11), (20, 21), (30, 28), (40, 37), (50, 48), (60, 56), (70, 68), (80, 75), (90, 86), (100, 96). Because of random error, repeated measurements on the same sample will vary. The apparatus is considered to be in calibration if its mean response is equal to the true concentration. To check the calibration, the linear model y = ß0 + ß1 + ε is fit. Ideally, the value of ß0 should be 0 and the value of ß1 should be 1. The least-squares estimate of the error standard deviation σ is closest to:If the linear equation between Height and Gestational Age is given as: Height=a + b Gest x What is the value of a from the output above What is the value of b from the output above
- The regression analysis shows that r^2 = 0.4688. What would the correlation be? A. r = √0.4688 B. r = −√0.4688 C. Both A and B. D. None of the above.please answer number 29You were asked to help with analysis of birth weights (BW) of 10,000 infants born in NYC during a certain period of time. The aim of the analysis is to see whether the birth weights of the infants are associated with mothers AGE at birth (continuous variable in years) and mothers smoking status (the maternal smoking status MSS contains 4 categories “Non-smoker”, “Past-smoker”, “Passive-smoker”, “Smoker”) and NYC boroughs (the BOROUGH variable contains 5 categories “Manhattan”, “Bronx”, “Brooklyn”, “Queens” and “State Island”). Write down the population model that assumes the effect of mother’s AGE at birth on infant weight BW is DIFFERENT for different levels of maternal smoking status (MSS) when adjusted for BOROUGH variable. Specify the name of each predictor in the model and/or what it means. Make sure that it is clear what each predictor means.
- Given the “data” determined by y = x^3 + (x-1)^2 with x = 0.1, 1.2, 2.3, and 2.9, calculate SSTO, SSR, and R^2. Then recalculate these using x = 0.3, 1, 2.45, and 2.8. Does where you collect your data (i.e., which values of x) appear to impact your interpretation of how good the linear model fits?.** Based on the regression results, answer the following questions ** A sample of data is collected (from 1999 and 2000) concerning the compensation of the executives (compensation is measured in 1000’s of $’s) of a number of public companies along with other firm-specific data. The dependent variable is total compensation, CEOANN is a dummy variable =1 for an individual who is a CEO and =0 for individuals who are not CEO’s, EMPL is total employees, MKTVAL is the natural logarithm of the market value of the firm, EPSIN is earnings per share, YEAR is a dummy variable = 1 for the year 2000 and =0 for year 1999, and ASSETS is the natural logarithm of the total assets of the company. Based on the regression results, answer the following questions b) What is the estimated regression equation? c) What percentage of the variation in income in explained by the regressors? d) What is the standard error of the error term in the regression equation?You were asked to help with analysis of birth weights (BW) of 10,000 infants born in NYC during a certain period of time. The aim of the analysis is to see whether the birth weights of the infants are associated with mothers AGE at birth (continuous variable in years) and mothers smoking status (the maternal smoking status MSS contains 4 categories “Non-smoker”, “Past-smoker”, “Passive-smoker”, “Smoker”) and NYC boroughs (the BOROUGH variable contains 5 categories “Manhattan”, “Bronx”, “Brooklyn”, “Queens” and “Staten Island”). Questions: 1.Write down the population model that estimates BW based on variables AGE and BOROUGH(with the dummy variables). Make sure that it is clear what each predictor means. 2.How many parallel lines are computed by model from population model you created above? 3.Write down the population model that estimates BW based on variables AGE, MSS(with their dummy variables) and BOROUGH(with their dummy variables). Also write down the number of parrallel lines.…