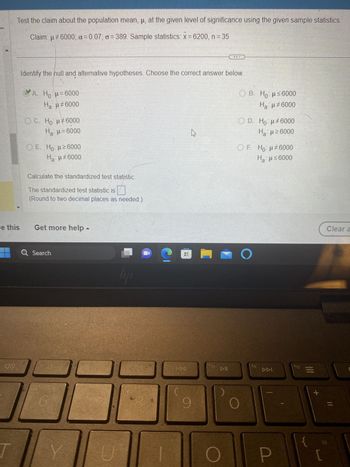
Test the claim about the population mean, µ, at the given level of significance using the given sample statistic Claim: μ#6000; α=0.07; o=389. Sample statistics: x=6200, n = 35 Identify the null and alternative hypotheses. Choose the correct answer below. OA. Ho μ-6000 Ha: μ#6000 OC. Ho μ#6000 H₂ μ = 6000 *** E. Ho: ²6000 H₂ μ#6000 O B. Ho μ≤6000 Ha μ#6000 O D. Ho μ#6000 Hg: με 6000 OF. Ho #6000 H₂ μ≤6000
Q: You wish to test the claim that the first population mean is less than the second population mean at…
A:
Q: A. Determine the test statistic B. Determine the critical value for chi square. C. Reject H0 or…
A: We want find test statistics, critical value and decision
Q: You wish to test the following claim (Ha) at a significance level of α=0.002. Ho:μ1=μ2…
A: Given : H0 : μ1 = μ2 H0 : μ1 < μ2 Sample 1 : x¯1 = ∑Xin x¯1 = 4473.760 x¯1 = 74.56 s1…
Q: Suppose we want to know whether or not the mean weight between two different species of rat is…
A: According to policy we supposed to answer first three part kindly repost for remaining.
Q: With good sampling practices, what percentage of possible values for the sample mean will lead to a…
A: Solution: Type I error: Reject the null hypothesis even though it is true.
Q: 7. Assume that you want to use a 0.05 significance level to test the claim that the paired sample…
A: The claim is that the paired sample data come from a population for which the mean difference is…
Q: Find the following chi-square distribution values from Table 11.1 or Table 3 of Appendix B. (to…
A: Solution
Q: If the critical value of t is 2.303, and the sample size is 13. Find the significance level (a).
A: we want to find value of alpha
Q: ou wish to test the following claim (HaHa) at a significance level of α=0.01α=0.01.…
A: Solution: Given information: n=53 Sample size μ=88.5 Population meanM=94.2 Sample meanσ=19.9…
Q: Use a t-test to test the claim about the population mean μ at the given level of significance α…
A: As per our guidelines we can solve first three subpart and rest can be reposted. Solution-: Here,…
Q: 3. Data Set "Earthquakes” lists earthquake depths, and the summery statistics are n=600, x=5.82 km,…
A: Given claim: The population mean equal to 5.00 km. Null Hypothesis: H0:μ=5 Alternative Hypothesis:…
Q: Given a critical t score of -2.33 and t observed being -2.01, the decision you should make is…
A: It is given that the critical t score is -2.33 and the observed t value is -2.01.
Q: You wish to test the following claim (HaHa) at a significance level of α=0.01α=0.01.…
A: There are two independent samples which follows normal distribution. We have to test whether the…
Q: In the population of drivers, the mean number of traffic violations in the last 10 years is 5.2. In…
A: It is given that Population mean = 5.2 Sample mean = 4.25
Q: Test the claim about the population mean μ at the level of significance a. Assume the population is…
A:
Q: Data is sampled from a population for IQ scores that has an original σ=10 How much error should you…
A: Consider a random variable X, has mean µ and the standard deviation of σ. Central limit theorem: If…
Q: The median pH level of the rain in a certain county, was 4.90. A biologist obtains a random sample…
A: Given that, n=19 α=0.05 and μ=4.90 Here, we use the test statistics t=x¯-μsn where…
Q: You wish to test the following claim (HaHa) at a significance level of α=0.001α=0.001.…
A: The hypotheses are; This is a lower-tailed test. The level of significance, α is 0.001.
Q: You wish to test the following claim (HaHa) at a significance level of α=0.05α=0.05. Ho:μ1=μ2…
A: Given data is:
Q: The following information is available for two samples selected from independent normally…
A: n1=13, s12=59.5n2=21, s22=28.2
Q: You wish to test the following claim (H₁) at a significance level of a = 0.001. H₂:1₁ = 1₂ H_:μι <…
A: Given: Null Hypothesis H0:μ1=μ2 Alternative Hypothesis Ha:μ1<μ2 (claim) This is a left-tailed…
Q: You wish to test the following claim (Ha) at a significance level of α=0.005 Ho:μ1=μ2…
A: There are 2 independent samples which follows normal distribution. We have to test whether the first…
Q: You wish to test the claim that the first population mean is greater than the second population mean…
A: Note: Hey, since there are multiple subparts are posted, we will answer first three subparts for…
Q: You wish to test the following claim at a significance level of α=0.05α=0.05.…
A: Given,H0:μ=85.7Ha:μ<85.7sample size(n)=5mean(x¯)=73.4standard deviation(s)=9.8and α=0.05
Q: You wish to test the following claim (HaHa) at a significance level of α=0.05α=0.05.…
A: Given, Sample size = 80 Sample mean = 89.6 Population standard deviation = 10.9 Population mean =…
Q: You wish to test the following claim (HaHa) at a significance level of α=0.005 Ho:μ1=μ2…
A: There are 2 independent samples which follows normal distribution. We have to test whether the first…
Q: You wish to test the following claim (HaHa) at a significance level of α=0.002 Ho:μ1=μ2…
A: There are 2 independent samples which follows normal distribution. We have to test whether the first…
Q: 11. In a test of H0: μ=100 against Ha: μ≠100, the sample data yielded the test statistic z=1.80.…
A: Given, Test statistic z=1.80 And Test is two tailed test.
Q: A sample of 12 radon detectors of a certain type was selected, and each was exposed to 100 pCi/L of…
A: Given data: Population mean = 100 pCi/L of radon Sample size = 12 Significance level = 0.05 Claim:…
Q: Use the following sample to evaluate H0: μ = 65, at significance level α = 0.05. 53 75 68 53 57 12…
A: From the provided information, Significance level (α) = 0.05 And H0: μ = 65 Sample size (n) = 20
Q: You wish to test the following claim (HaHa) at a significance level of α=0.001α=0.001.…
A: We have given that data First I want to find mean and standard deviation from data. Null and…
Q: 11. Use a t-test to test the claim about the population mean μ at the given level of significance α…
A: Given,x¯=22.8s=4.3n=14claim: μ≠26H0:μ=26Ha:μ≠26and Test statistic(t)=-2.78
Q: 1. What type of test was used to analyze these data 2. what sample size of this study 3. what is…
A: From the given summary tablesample size n=15Mean=6.4000standard deviation =0.91206standard error…
Q: You wish to test the following claim (HaHa) at a significance level of α=0.001 Ho:μ1=μ2…
A:
Q: ou wish to test the following claim (HaHa) at a significance level of α=0.01α=0.01.…
A: Given: Sample size (n1) = 48 Sample size (n2) = 52 Significance level α = 0.01 Null Hypothesis…
Q: Test the claim about the population mean, μ, at the given level of significance using the given…
A: H0: μ=30H1: μ≠30Two tailed testb)α=0.04 α2=0.02 1-α2=0.98z*=invNorm0.98,0,1=±2.054critical…
Q: You wish to test the following claim (Ha) at a significance level of α=0.02 Ho:μ1=μ2…
A:
Q: You wish to test the following claim (HaHa) at a significance level of α=0.001α=0.001.…
A:
Q: You wish to test the following claim (HaHa) at a significance level of α=0.002α=0.002.…
A: Given information- Significance level, α = 0.002 Test Hypothesis is Null Hypothesis, H0: μ1 = μ2…
Q: he following sample data are from a normal population: Sample size (n) = 25, Sample mean=14,…
A: Formula for upper limit of the population mean interval: upper limit=x¯+tcriticalsn
Q: You wish to test the following claim (HaHa) at a significance level of α=0.01 Ho:μ1=μ2…
A: To test the claim (Ha) at a significance level of α=0.01 Null hypothesis, Ho:μ1=μ2…
Q: Determine whether the given conditions justify testing a claim about a population mean μ The sample…
A: Given sample size is n=17, σ = 4.33 the original population is normally distributed.
Q: You wish to test the following claim (HaHa) at a significance level of α=0.01α=0.01.…
A:
Q: population is normally distributed and you know the standard deviation is σ=13.8σ=13.8. You obtain a…
A: Given that Population normally distributed Population standard deviation (σ) = 13.8 Sample mean…
Q: Test the claim about the population mean u at the level of significance a. Assume the population is…
A: Given that, μ=1400, σ=82, x=1370, n=35, α=0.01 The null and alternate hypothesis is,…
Q: You believe both populations are normally distributed, but you do not know the standard deviations…
A: Given n1=20,x¯1=60.9,SD1=6.2 and n2=15,x¯2=76.9,SD2=18.6.
Step by step
Solved in 3 steps with 1 images
- You wish to test the following claim at a significance level of α=0.001α=0.001. Ho:μ1=μ2 Ha:μ1<μ2You obtain the following two samples of data. Sample #1 Sample #2 87 77.9 68.6 81.6 75.4 72.3 67.5 71.3 67.8 72.3 74.3 76.8 72.6 77.4 75.2 80 65.5 63.3 77.1 73.9 84.6 71.6 77.2 61.8 74.5 73 72.6 68.3 71.7 67.2 74.3 63.3 74 77.4 87 71.7 70.8 74.7 73 80.2 78 70.9 75.5 68.8 83.9 78.9 72.5 68.3 74.4 74.5 73.9 67.5 74.3 83.9 80.7 75.5 79 89 76.4 76 71.4 82.2 76 69.2 73 77.2 70.7 85.8 65.6 79.8 79.4 72.2 64.3 62.2 76.4 86.8 67.9 69.4 82.2 79.4 73.2 81.7 75 78.6 69.7 65 76.7 67.1 77.4 84.9 68.2 79 84.5 87.4 67.1 71.4 What is the test statistic for this sample? (Report answer accurate to three decimal places.)test statistic = What is the p-value for this sample? For this calculation, use the degrees of freedom reported from the technology you are using. (Report answer accurate to four decimal places.)p-value = The…You wish to test the following claim (Ha) at a significance level of a = 0.10. H₂:μ₁ = μ₂ H₁: M₁ M₂ You obtain the following two samples of data. Sample #1 97.5 95.3 84.6 95.9 79.9 90.3 85.9 81.6 88.4 92.1 82.1 94.3 69.3 94.8 74.5 83.4 82.1 81.8 92.8 84.1 92.1 98.7 93.9 92.8 78.5 69.3 88 82 85.2 76.3 92.8 85.1 92.4 93.1 90.3 100.5 85.2 87.3 What is the test statistic for this sample? (Report answer accurate to three decimal places.) test statistic = What is the p-value for this sample? For this calculation, use the degrees of freedom reported from the technology you are using. (Report answer accurate to four decimal places.) p-value = The p-value is... Sample #2 100.8 92.8 56.6 107.1 39.3 63.8 53.3 72 93.4 87.2 95.4 97.5 76.1 91 72 84.6 57.5 58.4 102.6 100.8 55.6 59.3 95.4 58.4 81.6 99.9 75.1 76.6 86.6 49.1 72.6 67.6 54.5 107.1 63.1 102.6 67 82.6 76.6 O less than (or equal to) a O greater than a This test statistic leads to a decision to... O reject the null O accept the null O fail to…You wish to test the following claim (HaHa) at a significance level of α=0.02. Ho:μ1=μ2 Ha:μ1<μ2You obtain the following two samples of data. Sample #1 Sample #2 84.3 84.3 66.6 68.8 52.2 45.5 38.2 43.8 77 63.6 46.3 47.8 72.9 71.1 67.9 100.2 51.6 24.9 97.2 69.7 69.3 60.5 24.9 61 64 85.1 65.8 68.8 49.8 73.4 36.6 63.2 97.2 46.3 40.7 83.5 46.3 68.4 45.5 61 48.5 84.3 43.8 55.4 52.8 60.1 59.6 63.2 44.7 45.5 68.6 66.6 73.3 71.3 67.5 61.4 54 57.6 62.8 56.9 86.8 84.7 81.1 81.5 68.6 69.7 75.2 59.3 67.5 82.6 61.4 64.8 75.7 60.2 78.7 82.6 79.1 64.5 83.9 65.8 74.2 90.6 77.1 64.3 74.5 64.8 77.7 64 86.8 57.6 79.4 81.5 66.8 What is the test statistic for this sample? (Report answer accurate to three decimal places.)test statistic = What is the p-value for this sample? For this calculation, use the degrees of freedom reported from the technology you are using. (Report answer accurate to four decimal places.)p-value =…
- You wish to test the following claim (HaHa) at a significance level of α=0.05α=0.05. Ho:μ=65.4Ho:μ=65.4 Ha:μ>65.4Ha:μ>65.4You believe the population is normally distributed and you know the standard deviation is σ=7.2σ=7.2. You obtain a sample mean of M=66.3M=66.3 for a sample of size n=63n=63.What is the test statistic for this sample? (Report answer accurate to three decimal places.)test statistic = ____ What is the p-value for this sample? (Report answer accurate to four decimal places.)p-value = ____A sample of 12 radon detectors of a certain type was selected, and each was exposed to 100 pCi/L of radon. The resulting readings were as follows: 104.3 89.6 89.9 95.6 95.2 90.0 98.8 103.7 98.3 106.4 102.0 91.1 a)Does this data suggest that the population mean reading under these conditions differs from 100? State and test the appropriate hypotheses using =.05. b) Suppose that prior to the experiment, a value of teta=7.5 had been assumed. How many determinations would then have been appropriate to obtain beta=.10 for the alternative u=95 ?You wish to test the following claim (Ha) at a significance level of a = 0.002. H.: µ1 < µ2 You obtain the following two samples of data. H.:µ1 = µ2 93.9 83.5 80.5 103.9 56.1 81.5 95.2 52 75.1 88 63.1 72 81.5 95.2 84.6 66.7 91.4 100.5 84 62 46 61.7 32.7 118.1 58.6 95.7 95.7 65.6 74.7 61.7 84.6 75.2 73.7 56.6 106.2 84 103.1 84.6 98.3 47.8 50.9 80 62.6 76.4 85.1 101 105.5 91.3 92.2 94.8 78.6 62.6 71.6 105.5 75.2 65.6 Sample #1 Sample #2 54.4 69.3 46.1 96.8 88.3 106.9 106.9 123.5 58.6 55.9 32.6 82 81 81 101 69 63.6 60.4 57.3 86.8 66.7 118.1 82.5 101 66.6 93 62.6 57.9 71.1 69.5 94.5 81.5 93.2 123.5 67.9 94.5 100.1 52 66.7 53.1 103.1 114.8 83.5 76.6 60.3 54.2 What is the test statistic for this sample? (Report answer accurate to three decimal places.) test statistic = What is the p-value for this sample? For this calculation, use the degrees of freedom reported from the technology you are using. (Report answer accurate to four decimal places.) p-value =
- You wish to test the following claim (Ha) at a significance level of α=0.001 Ho:μ1=μ2Ho Ha:μ1>μ2You obtain the following two samples of data. Sample #1 Sample #2 84.3 71.4 82.2 111.4 70.5 61.3 61.3 95.6 62 87.5 76.1 67.2 74 94.2 68.2 71.9 62.6 76.5 71.4 69.6 72.3 77.3 62 74 77.3 83.9 71.4 96.3 72.7 85.7 92.3 85.7 91.2 65 78.5 62 89 57.3 80.1 78.5 86.6 59.9 47.6 62.6 81.8 62 88.5 90.1 72.7 79.3 91.2 98.9 82.2 55.3 78.9 92.1 62.5 78.6 77.2 59 70.7 67 82.7 64.7 71.9 46.9 76.2 79.3 75.9 78.6 87.3 69.5 93.7 76.9 93.7 65.7 57.3 70.4 65.7 60.9 72.5 48.9 68.3 87.3 59 56.7 75.6 73.1 79 89.8 79.3 43.6 99 64.7 46.9 74.3 67 90.9 What is the test statistic for this sample? (Report answer accurate to three decimal places.)test statistic = What is the p-value for this sample? For this calculation, use the degrees of freedom reported from the technology you are using. (Report answer accurate to four decimal…You wish to test the following claim (HaHa) at a significance level of α=0.05α=0.05. Ho:μ=64.3Ho:μ=64.3 Ha:μ<64.3Ha:μ<64.3You believe the population is normally distributed and you know the standard deviation is σ=5.2σ=5.2. You obtain a sample mean of M=62.2M=62.2 for a sample of size n=46n=46.What is the test statistic for this sample? (Report answer accurate to two decimal places.)test statistic = What is the p-value for this sample? (Report answer accurate to four decimal places.)p-value = The p-value is... less than (or equal to) αα greater than αα This test statistic leads to a decision to... reject the null accept the null fail to reject the null As such, the final conclusion is that... There is sufficient evidence to warrant rejection of the claim that the population mean is less than 64.3. There is not sufficient evidence to warrant rejection of the claim that the population mean is less than 64.3. The sample data support the claim that the population…1. Given n = 10, E, x? = 100, and = 1, compute the sample standard deviation s. 2. Given n = 100,E, 1? = 10000, and E, x; = 1000, compute the sample variance s². i3D1 i31
- 1. What is the standardized test statistic? t = ___. 2. What is/are the critical value(s)?200 people were randomly sampled and asked what they regularly eat for breakfast or lunch. Each person was identified as either a consumer or a non consumer of high-fiber cereals, and the number of calories consumed at lunch was measured and recorded. These data are summarized below; Consumer of high fiber cereals Non consumer of high fiber cereals η1 =41 η2 = 159 Mean 1 =603 Mean 2 =639 Stanadard deviation 1 = 110 Standard deviation 2 = 141 If the scientist claims that people who eat high fiber cereals for breakfast do consume on average fewer calories for lunch than people who don’t eat high fiber cereals for breakfast, and if it is true, high fiber cereal manufacturer will be able to claim another advantage of eating their products-potential weight reduction for dieter. REQUIRED Are there sufficient evidence at 5% significance level to support the above claim?4. Test the claim about the population mean, μ,at the given level of significance using the given sample statistics. Claim: μ≠6000; α=0.08; σ=399. Sample statistics: x=6300, n=37 Determine the outcome and conclusion of the test. Choose from the following. A. Fail to reject H0. At the 8% significance level, there is not enough evidence to reject the claim. B. Reject H0. At the 8% significance level, there is enough evidence to reject the claim. C. Reject H0. At the 8% significance level, there is enough evidence to support the claim. D. Fail to reject H0. At the 8% significance level, there is not enough evidence to support the claim.