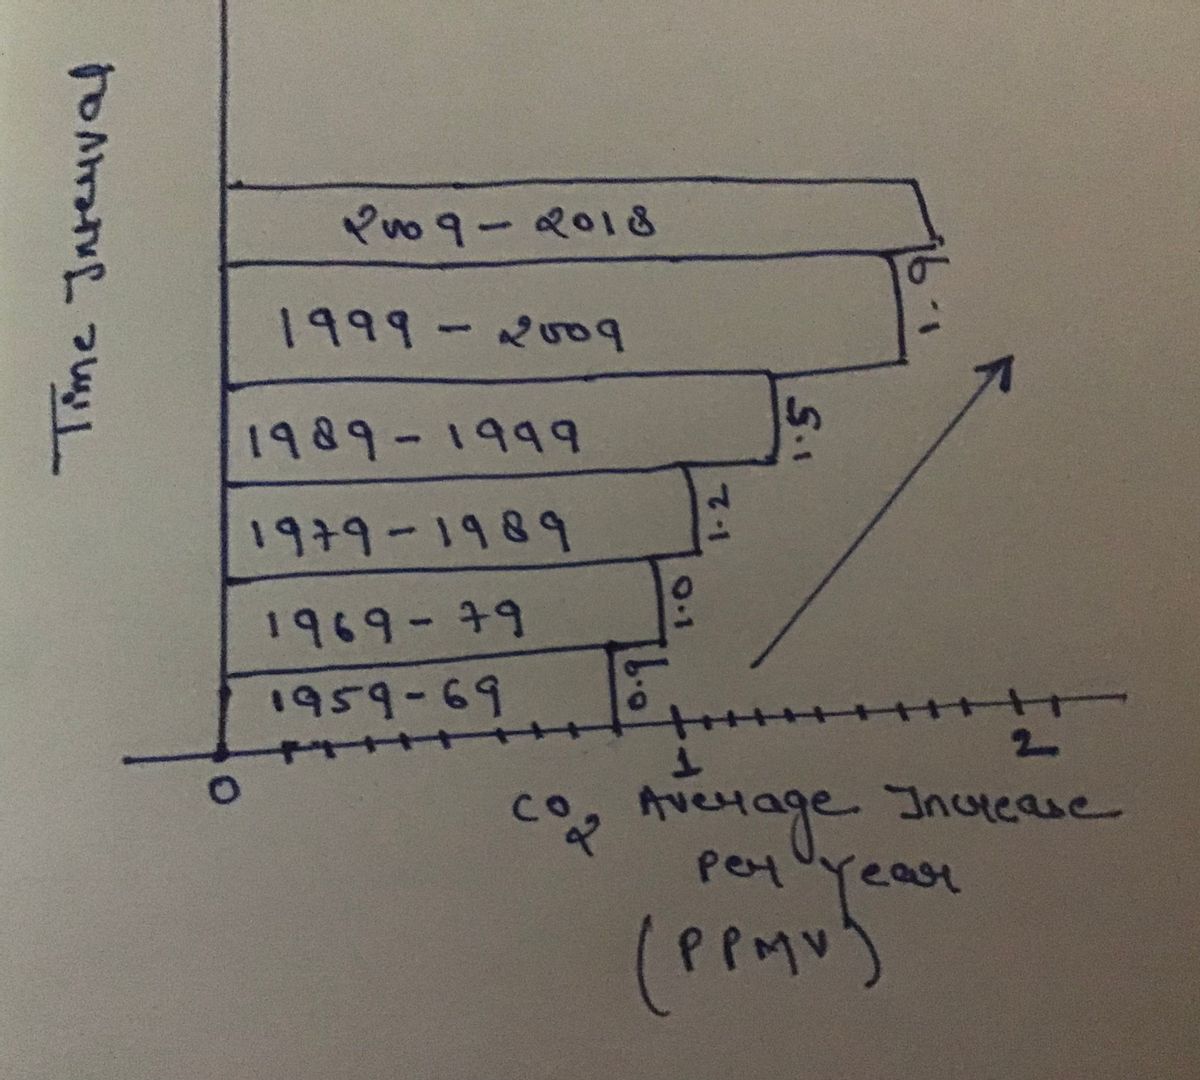
I need help with these questions to the problem. 1.Calculate the average rate of increase in concentration per year for the time intervals 1959–1969, 1969–1979, 1979–1989, 1989–1999, 1999–2009, and 2009–2018, and write the results in the spaces provided in Fig. A1.7.2. The value for 1959–1969 is provided for you as an example 2.Plot the results as a bar graph. The 1959–1969 bar is plotted for you. 3. Briefly describe how you interpret the information you plotted in the bar graph.
I need help with these questions to the problem. 1.Calculate the average rate of increase in concentration per year for the time intervals 1959–1969, 1969–1979, 1979–1989, 1989–1999, 1999–2009, and 2009–2018, and write the results in the spaces provided in Fig. A1.7.2. The value for 1959–1969 is provided for you as an example 2.Plot the results as a bar graph. The 1959–1969 bar is plotted for you. 3. Briefly describe how you interpret the information you plotted in the bar graph.
Applications and Investigations in Earth Science (9th Edition)
9th Edition
ISBN:9780134746241
Author:Edward J. Tarbuck, Frederick K. Lutgens, Dennis G. Tasa
Publisher:Edward J. Tarbuck, Frederick K. Lutgens, Dennis G. Tasa
Chapter1: The Study Of Minerals
Section: Chapter Questions
Problem 1LR
Related questions
Question
I need help with these questions to the problem.
1.Calculate the average rate of increase in concentration per year for the time intervals 1959–1969, 1969–1979, 1979–1989, 1989–1999, 1999–2009, and 2009–2018, and write the results in the spaces provided in Fig. A1.7.2. The value for 1959–1969 is provided for you as an example
2.Plot the results as a bar graph. The 1959–1969 bar is plotted for you.
3. Briefly describe how you interpret the information you plotted in the bar graph.

Transcribed Image Text:Figure A1.7.2
Average Yearly Rate of
Increase in the Concentration
of Atmospheric Carbon
Dioxide (CO) at Mauna Loa
Observatory, Hawaii
Time
interval
1959 1969
1969-1979
1979-1989
1989-1999
1999-2009
2009-2018
Rate of increase
per year
0.9
Time interval
2009-2018
1999-2009
1989-1999
1979-1989
1969-1979
1959-1969
1.0
CO₂ Average Increase/Year (ppmv)
2.0
2.5
Expert Solution
Step 1
| time intervals | average rate of increase in CO, concentration per year |
| 1959-1969 | 0.9 |
| 1969-1979 | 1.O |
| 1979-1989 | 1.2 |
| 1989-1999 | 1.5 |
| 1999-2009 | 1.9 |
| 2009-2018 | 2.1 |
ANSWER 2

Trending now
This is a popular solution!
Step by step
Solved in 2 steps with 1 images

Recommended textbooks for you

Applications and Investigations in Earth Science …
Earth Science
ISBN:
9780134746241
Author:
Edward J. Tarbuck, Frederick K. Lutgens, Dennis G. Tasa
Publisher:
PEARSON

Exercises for Weather & Climate (9th Edition)
Earth Science
ISBN:
9780134041360
Author:
Greg Carbone
Publisher:
PEARSON

Environmental Science
Earth Science
ISBN:
9781260153125
Author:
William P Cunningham Prof., Mary Ann Cunningham Professor
Publisher:
McGraw-Hill Education

Applications and Investigations in Earth Science …
Earth Science
ISBN:
9780134746241
Author:
Edward J. Tarbuck, Frederick K. Lutgens, Dennis G. Tasa
Publisher:
PEARSON

Exercises for Weather & Climate (9th Edition)
Earth Science
ISBN:
9780134041360
Author:
Greg Carbone
Publisher:
PEARSON

Environmental Science
Earth Science
ISBN:
9781260153125
Author:
William P Cunningham Prof., Mary Ann Cunningham Professor
Publisher:
McGraw-Hill Education

Earth Science (15th Edition)
Earth Science
ISBN:
9780134543536
Author:
Edward J. Tarbuck, Frederick K. Lutgens, Dennis G. Tasa
Publisher:
PEARSON

Environmental Science (MindTap Course List)
Earth Science
ISBN:
9781337569613
Author:
G. Tyler Miller, Scott Spoolman
Publisher:
Cengage Learning

Physical Geology
Earth Science
ISBN:
9781259916823
Author:
Plummer, Charles C., CARLSON, Diane H., Hammersley, Lisa
Publisher:
Mcgraw-hill Education,