i) Find the conditional distribution of the likelihood function given the function of the statistic, 6 = ₁X₁. Hint: Apply f(L(0)|g(8,0)). ii) Based on i) above, is = 1X, a sufficient statistic? Justify your answer. iii) Show whether or not X, is a consistent estimator of the parameter
i) Find the conditional distribution of the likelihood function given the function of the statistic, 6 = ₁X₁. Hint: Apply f(L(0)|g(8,0)). ii) Based on i) above, is = 1X, a sufficient statistic? Justify your answer. iii) Show whether or not X, is a consistent estimator of the parameter

A First Course in Probability (10th Edition)
10th Edition
ISBN:9780134753119
Author:Sheldon Ross
Publisher:Sheldon Ross
Chapter1: Combinatorial Analysis
Section: Chapter Questions
Problem 1.1P: a. How many different 7-place license plates are possible if the first 2 places are for letters and...

Related questions
Question

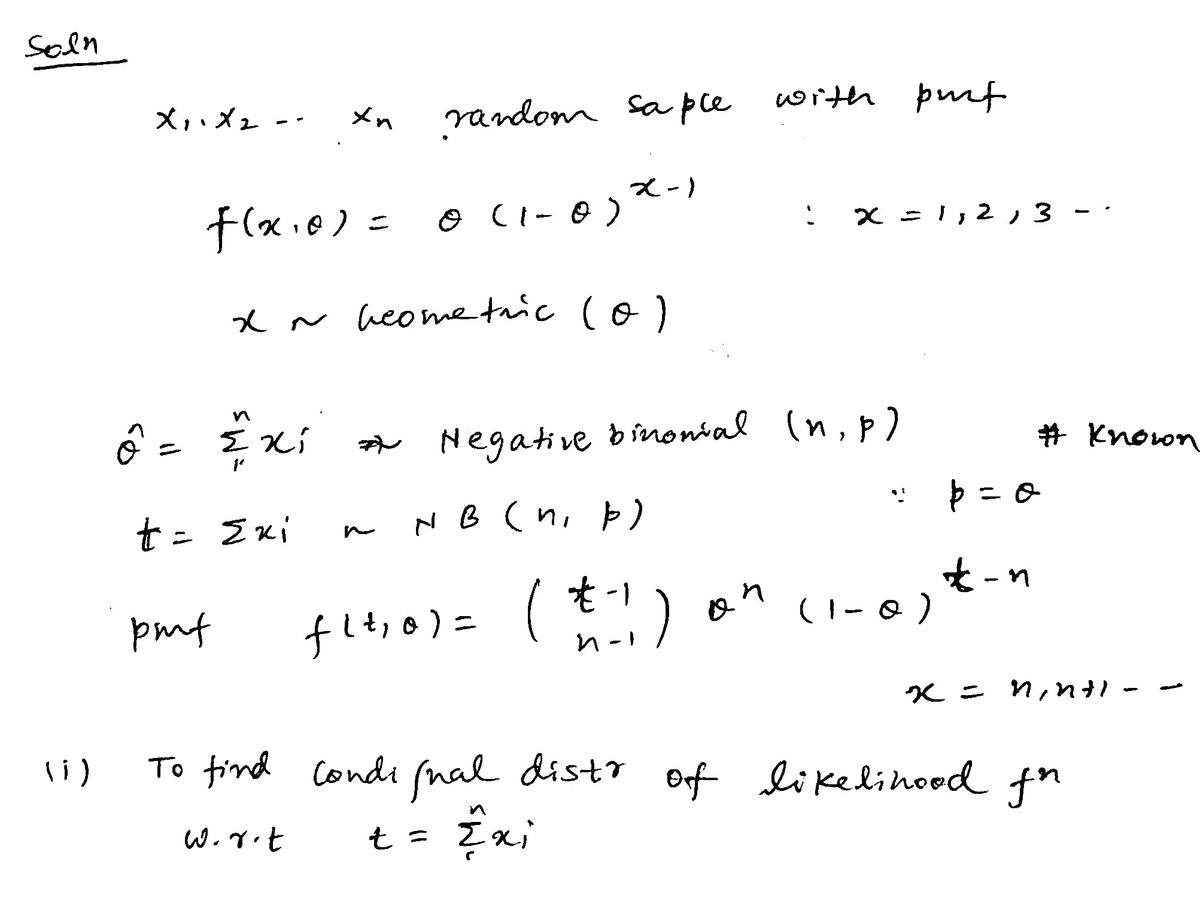
Transcribed Image Text:a) Let X₁, X₂, X, be a random sample of size n from population X. Suppose that X has the
following probability mass function:
f(x; 0) = {0(1
(0 (1-0)*-1,
x = 1,2,3,...
elsewhere
i) Find the conditional distribution of the likelihood function given the function of the statistic,
6 = 1X₁. Hint: Apply f(L(0)|g(0,0)).
ii) Based on i) above, is = 1X₁ a sufficient statistic? Justify your answer.
iii) Show whether or not X, is a consistent estimator of the parameter
Expert Solution
Step 1

Step by step
Solved in 3 steps with 3 images

Recommended textbooks for you
A First Course in Probability (10th Edition)
Probability
ISBN:
9780134753119
Author:
Sheldon Ross
Publisher:
PEARSON

A First Course in Probability (10th Edition)
Probability
ISBN:
9780134753119
Author:
Sheldon Ross
Publisher:
PEARSON