Homework: One researcher posited that chemistry understanding is dependent on understanding mathematics. They conducted an experiment examining mathematics understanding of a certain topic (on a scale of 8) and the related chemistry understanding (on a scale of 8) and found the following data. |Mathematics | Chemistry 6.5 4.5 6 4 7 5 5 3.5 a. Conduct linear regression by hand to find a best fit line for the data. b. Calculate the correlation coefficient for the line by hand. Interpret results.
Homework: One researcher posited that chemistry understanding is dependent on understanding mathematics. They conducted an experiment examining mathematics understanding of a certain topic (on a scale of 8) and the related chemistry understanding (on a scale of 8) and found the following data. |Mathematics | Chemistry 6.5 4.5 6 4 7 5 5 3.5 a. Conduct linear regression by hand to find a best fit line for the data. b. Calculate the correlation coefficient for the line by hand. Interpret results.

MATLAB: An Introduction with Applications
6th Edition
ISBN:9781119256830
Author:Amos Gilat
Publisher:Amos Gilat
Chapter1: Starting With Matlab
Section: Chapter Questions
Problem 1P

Related questions
Topic Video
Question
Question in attached image.

Transcribed Image Text:Homework: One researcher posited that chemistry understanding is dependent on understanding mathematics. They conducted an experiment examining mathematics understanding of a certain topic (on a scale of 8) and the related chemistry understanding (on a scale of 8) and found the following data.
| Mathematics | Chemistry |
|-------------|-----------|
| 6 | 6.5 |
| 4 | 4.5 |
| 8 | 7 |
| 5 | 5 |
| 3.5 | 4 |
a. Conduct linear regression by hand to find a best fit line for the data.
b. Calculate the correlation coefficient for the line by hand. Interpret results.
**Explanation:**
This homework task involves using statistical methods to analyze the relationship between mathematics and chemistry understanding. It requires calculating the line of best fit using linear regression and determining the strength of the relationship with the correlation coefficient. Students are encouraged to perform these calculations manually to deepen their understanding of the methods.
Expert Solution
Step 1
(a)
Obtain the value of b(slope)
The value of slope is obtained below as follows:
The value of x is obtained below:
From the information, given that
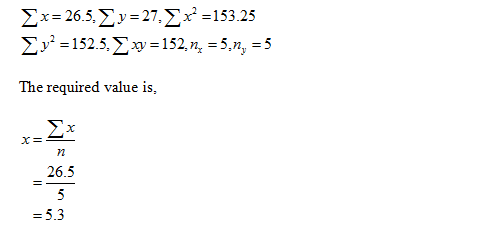
Thus, the value of x is 5.3
Obtain the value of y.
The value of y is obtained below:
The required value is,
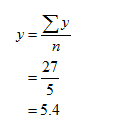
Thus, the value of y is 5.4
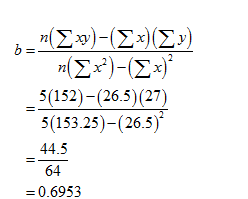
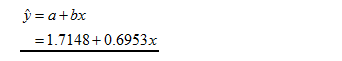
Thus, the value of b is 0.6953.
Obtain the value of a
The value of a is obtained below:
The formula to obtain a is,
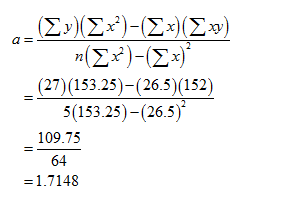
Thus, the value of a is 1.7148.
Thus, the required regression equation is,

Trending now
This is a popular solution!

Step by step
Solved in 2 steps with 7 images

Knowledge Booster


Learn more about
Need a deep-dive on the concept behind this application? Look no further. Learn more about this topic, statistics and related others by exploring similar questions and additional content below.Recommended textbooks for you
MATLAB: An Introduction with Applications
Statistics
ISBN:
9781119256830
Author:
Amos Gilat
Publisher:
John Wiley & Sons Inc

Probability and Statistics for Engineering and th…
Statistics
ISBN:
9781305251809
Author:
Jay L. Devore
Publisher:
Cengage Learning

Statistics for The Behavioral Sciences (MindTap C…
Statistics
ISBN:
9781305504912
Author:
Frederick J Gravetter, Larry B. Wallnau
Publisher:
Cengage Learning
MATLAB: An Introduction with Applications
Statistics
ISBN:
9781119256830
Author:
Amos Gilat
Publisher:
John Wiley & Sons Inc
Probability and Statistics for Engineering and th…
Statistics
ISBN:
9781305251809
Author:
Jay L. Devore
Publisher:
Cengage Learning
Statistics for The Behavioral Sciences (MindTap C…
Statistics
ISBN:
9781305504912
Author:
Frederick J Gravetter, Larry B. Wallnau
Publisher:
Cengage Learning

Elementary Statistics: Picturing the World (7th E…
Statistics
ISBN:
9780134683416
Author:
Ron Larson, Betsy Farber
Publisher:
PEARSON

The Basic Practice of Statistics
Statistics
ISBN:
9781319042578
Author:
David S. Moore, William I. Notz, Michael A. Fligner
Publisher:
W. H. Freeman

Introduction to the Practice of Statistics
Statistics
ISBN:
9781319013387
Author:
David S. Moore, George P. McCabe, Bruce A. Craig
Publisher:
W. H. Freeman