Hey can you help me with this by drawing a graph. The thing being tested is if lizards eat more during hot or cool temperatures. The data is shown in the picture below
Hey can you help me with this by drawing a graph. The thing being tested is if lizards eat more during hot or cool temperatures. The data is shown in the picture below

MATLAB: An Introduction with Applications
6th Edition
ISBN:9781119256830
Author:Amos Gilat
Publisher:Amos Gilat
Chapter1: Starting With Matlab
Section: Chapter Questions
Problem 1P

Related questions
Question
Hey can you help me with this by drawing a graph. The thing being tested is if lizards eat more during hot or cool temperatures. The data is shown in the picture below. Thank you

Transcribed Image Text:After considering various factors about lizards, discussing with colleagues, and conducting background research, you develop a design for your lizard feeding experiment as follows:
- 1 lizard per cage. Cages are in the lab at four different temperatures shown below.
- Five replicate cages per temperature treatment.
- Lizards are all adult males of the same species, of a similar size, and have been maintained on a similar feeding regimen under similar conditions.
- Each cage receives 10 large crickets, and you count the number consumed after 24 hours.
After obtaining the necessary equipment and approvals, you conduct your experiment and gather the following data:
| Lizard ID | Temp (°F) | Temp (°C) | Crickets Eaten |
|-----------|-----------|-----------|----------------|
| A | 70 | 21 | 5 |
| B | 70 | 21 | 3 |
| C | 70 | 21 | 4 |
| D | 70 | 21 | 6 |
| E | 70 | 21 | 5 |
| F | 80 | 27 | 7 |
| G | 80 | 27 | 7 |
| H | 80 | 27 | 6 |
| I | 80 | 27 | 8 |
| J | 80 | 27 | 8 |
| K | 90 | 32 | 10 |
| L | 90 | 32 | 9 |
| M | 90 | 32 | 3 |
| N | 90 | 32 | 7 |
| O | 90 | 32 | 7 |
| P | 100 | 38 | 5 |
| Q | 100 | 38 | 5 |
| R | 100 | 38 | 5 |
| S | 100 | 38 | 5 |
| T | 100 | 38 | 4 |
**Visualization Suggestion:**
Create a graph by hand to visualize these results. Use the temperature (°
Expert Solution
Step 1
From the given information,
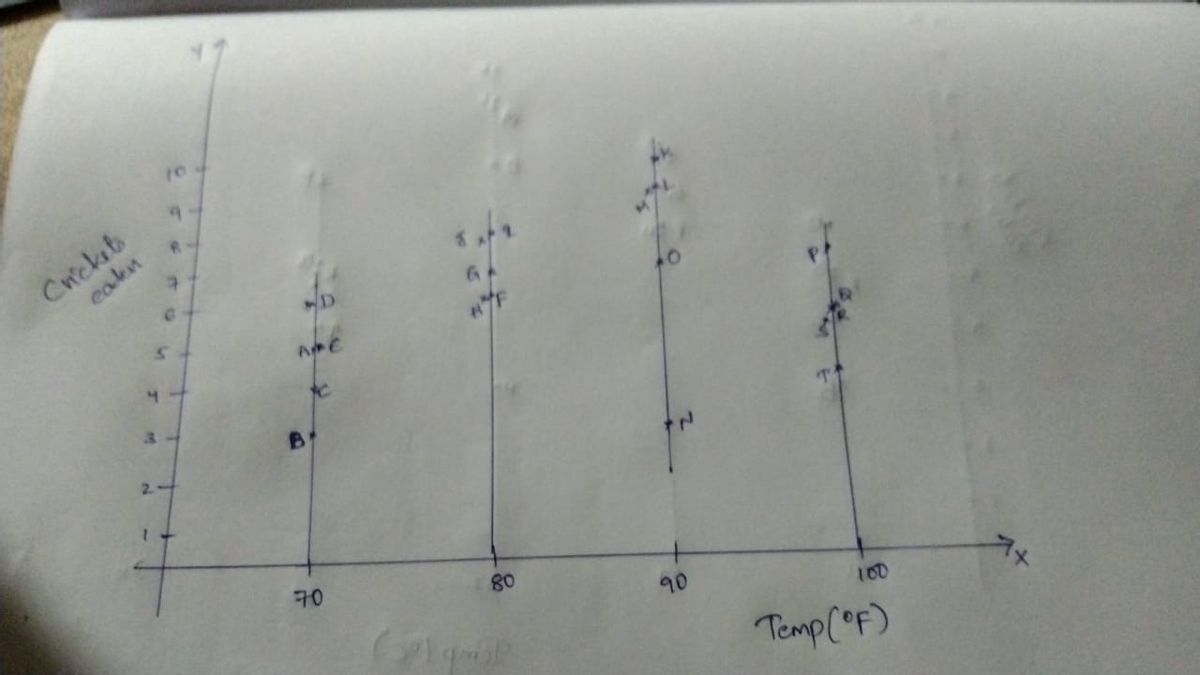
| Temp(F) | Temp(c) | Crickets eaten |
| 70 | 21 | 5 |
| 70 | 21 | 3 |
| 70 | 21 | 4 |
| 70 | 21 | 6 |
| 70 | 21 | 5 |
| 80 | 27 | 6 |
| 80 | 27 | 7 |
| 80 | 27 | 6 |
| 80 | 27 | 8 |
| 80 | 27 | 8 |
| 90 | 32 | 10 |
| 90 | 32 | 9 |
| 90 | 32 | 9 |
| 90 | 32 | 3 |
| 90 | 32 | 7 |
| 100 | 38 | 7 |
| 100 | 38 | 5 |
| 100 | 38 | 5 |
| 100 | 38 | 5 |
| 100 | 38 | 4 |
Graph of Temp(F) and Crickets eaten:

Step by step
Solved in 2 steps with 2 images

Recommended textbooks for you
MATLAB: An Introduction with Applications
Statistics
ISBN:
9781119256830
Author:
Amos Gilat
Publisher:
John Wiley & Sons Inc

Probability and Statistics for Engineering and th…
Statistics
ISBN:
9781305251809
Author:
Jay L. Devore
Publisher:
Cengage Learning

Statistics for The Behavioral Sciences (MindTap C…
Statistics
ISBN:
9781305504912
Author:
Frederick J Gravetter, Larry B. Wallnau
Publisher:
Cengage Learning
MATLAB: An Introduction with Applications
Statistics
ISBN:
9781119256830
Author:
Amos Gilat
Publisher:
John Wiley & Sons Inc
Probability and Statistics for Engineering and th…
Statistics
ISBN:
9781305251809
Author:
Jay L. Devore
Publisher:
Cengage Learning
Statistics for The Behavioral Sciences (MindTap C…
Statistics
ISBN:
9781305504912
Author:
Frederick J Gravetter, Larry B. Wallnau
Publisher:
Cengage Learning

Elementary Statistics: Picturing the World (7th E…
Statistics
ISBN:
9780134683416
Author:
Ron Larson, Betsy Farber
Publisher:
PEARSON

The Basic Practice of Statistics
Statistics
ISBN:
9781319042578
Author:
David S. Moore, William I. Notz, Michael A. Fligner
Publisher:
W. H. Freeman

Introduction to the Practice of Statistics
Statistics
ISBN:
9781319013387
Author:
David S. Moore, George P. McCabe, Bruce A. Craig
Publisher:
W. H. Freeman