A random sample of the closing stock prices in dollars for a company in a recent year is listed below. Assume that o is $2.05. Construct the 90% and 99% confidence intervals for the population mean. Interpret the results and compare the widths of the confidence intervals. 20.05 17.97 17.49 16.95 21.71 16.51 The 90% confidence interval is ($.$). (Round to two decimal places as needed.) 22.72 20.45 17.81 15.54 16.34 15.41 18.73 19.13 15.67 16.84 O
A random sample of the closing stock prices in dollars for a company in a recent year is listed below. Assume that o is $2.05. Construct the 90% and 99% confidence intervals for the population mean. Interpret the results and compare the widths of the confidence intervals. 20.05 17.97 17.49 16.95 21.71 16.51 The 90% confidence interval is ($.$). (Round to two decimal places as needed.) 22.72 20.45 17.81 15.54 16.34 15.41 18.73 19.13 15.67 16.84 O
MATLAB: An Introduction with Applications
6th Edition
ISBN:9781119256830
Author:Amos Gilat
Publisher:Amos Gilat
Chapter1: Starting With Matlab
Section: Chapter Questions
Problem 1P
Related questions
Question

Transcribed Image Text:### Understanding Confidence Intervals in Stock Price Analysis
A random sample of the closing stock prices in dollars for a company in a recent year is provided below. Assume that the standard deviation (\( \sigma \)) is $2.05.
Your task is to construct the 90% and 99% confidence intervals for the population mean. Following this, interpret the results and compare the widths of the confidence intervals to understand the degree of confidence versus interval precision.
Here are the stock prices:
- 20.05
- 17.49
- 21.71
- 22.72
- 17.81
- 16.34
- 18.73
- 15.67
- 17.97
- 16.95
- 16.51
- 20.45
- 15.54
- 15.41
- 19.13
- 16.84
#### Calculating the Confidence Intervals
- **90% Confidence Interval**:
- The interval is represented as \( (\$, \$) \).
- (Round your final answers to two decimal places as needed.)
Understanding and correctly interpreting the confidence intervals is crucial to making informed decisions based on statistical data analysis. The width of the interval indicates the precision of the estimate—with narrower intervals showing more precise estimates but less confidence, and wider intervals offering greater confidence but less precision.
Expert Solution
This question has been solved!
Explore an expertly crafted, step-by-step solution for a thorough understanding of key concepts.
This is a popular solution!
Trending now
This is a popular solution!
Step by step
Solved in 5 steps with 2 images

Follow-up Questions
Read through expert solutions to related follow-up questions below.
Follow-up Question
Hello, I submitted your answer and it says it incorrect. Our text book uses zcore tables up to 4 decimal places. and this is the explanation for why your answer is incorrect. Could you please review and inform me of how to find the answer? What is the correct answer?

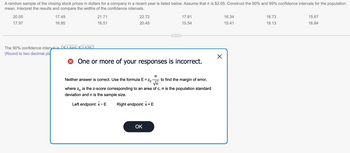
Transcribed Image Text:A random sample of the closing stock prices in dollars for a company in a recent year is listed below. Assume that o is $2.05. Construct the 90% and 99% confidence intervals for the population
mean. Interpret the results and compare the widths of the confidence intervals.
20.05
17.97
17.49
16.95
The 90% confidence intervalis ($1.645 $2.576)).
(Round to two decimal pla
21.71
16.51
22.72
20.45
17.81
15.54
> One or more of your responses is incorrect.
O
Neither answer is correct. Use the formula E = Zc to find the margin of error,
√n
where Ze is the z-score corresponding to an area of c, o is the population standard
deviation and n is the sample size.
Left endpoint: x-E Right endpoint: x + E
OK
X
16.34
15.41
18.73
19.13
15.67
16.84
Solution
Recommended textbooks for you

MATLAB: An Introduction with Applications
Statistics
ISBN:
9781119256830
Author:
Amos Gilat
Publisher:
John Wiley & Sons Inc

Probability and Statistics for Engineering and th…
Statistics
ISBN:
9781305251809
Author:
Jay L. Devore
Publisher:
Cengage Learning

Statistics for The Behavioral Sciences (MindTap C…
Statistics
ISBN:
9781305504912
Author:
Frederick J Gravetter, Larry B. Wallnau
Publisher:
Cengage Learning

MATLAB: An Introduction with Applications
Statistics
ISBN:
9781119256830
Author:
Amos Gilat
Publisher:
John Wiley & Sons Inc

Probability and Statistics for Engineering and th…
Statistics
ISBN:
9781305251809
Author:
Jay L. Devore
Publisher:
Cengage Learning

Statistics for The Behavioral Sciences (MindTap C…
Statistics
ISBN:
9781305504912
Author:
Frederick J Gravetter, Larry B. Wallnau
Publisher:
Cengage Learning

Elementary Statistics: Picturing the World (7th E…
Statistics
ISBN:
9780134683416
Author:
Ron Larson, Betsy Farber
Publisher:
PEARSON

The Basic Practice of Statistics
Statistics
ISBN:
9781319042578
Author:
David S. Moore, William I. Notz, Michael A. Fligner
Publisher:
W. H. Freeman

Introduction to the Practice of Statistics
Statistics
ISBN:
9781319013387
Author:
David S. Moore, George P. McCabe, Bruce A. Craig
Publisher:
W. H. Freeman