he answer and work to this question is wrong, can you correct. tip: Use the first law of thermodynamics which involves the work done by the gas, and the change in the internal energy of the gas. The ideal gas law will help. Use the average of the initial and final pressure to calculate the work. The PV diagram shows the compression of 40.9 moles of an ideal monoatomic gas from state A to state B. Calculate Q, the heat added to the gas in the process A to B. Data: PA= 1.90E+5 N/m2 VA= 1.83E+0 m3 PB= 1.01E+5 N/m2 VB= 8.90E-1 m3›44 heat added = work done ( since this is isothermal process) Heat added = area of pressure volume curve = (1/2) (sum of parallel sides)(height) = (1/2) (190000 + 101000) * (1.83 - 0.89) = (1/2) (291000) (0.94) = 136770 Joules

The answer and work to this question is wrong, can you correct.
tip: Use the first law of
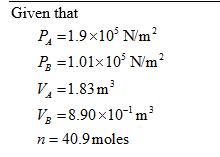
The PV diagram shows the compression of 40.9 moles of an ideal monoatomic gas from state A to state B. Calculate Q, the heat added to the gas in the process A to B. Data: PA= 1.90E+5 N/m2 VA= 1.83E+0 m3 PB= 1.01E+5 N/m2 VB= 8.90E-1 m3›44
heat added = work done ( since this is isothermal process)
Heat added = area of pressure volume curve
= (1/2) (sum of parallel sides)(height)
= (1/2) (190000 + 101000) * (1.83 - 0.89)
= (1/2) (291000) (0.94)
= 136770 Joules


Step by step
Solved in 2 steps with 3 images
