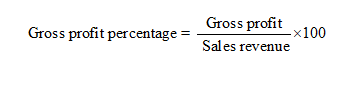
Gross Profit Percentage Calculate the company's 2020 gross profit percentage and compare the result to the industry average
Gross Profit Percentage Calculate the company's 2020 gross profit percentage and compare the result to the industry average

Chapter1: Financial Statements And Business Decisions
Section: Chapter Questions
Problem 1Q

Related questions
Question
Gross Profit Percentage
Calculate the company's 2020 gross profit percentage and compare the result to the industry average.

Transcribed Image Text:Assignments with the ne logo in the margin are available in BusinessCourse.
See the Preface of the book for details.
SHORT EXERCISES
Use the following financial data for Hi-Tech Instruments to answer Short Exercises 12-1 through 12-10:
2020 (Thousands of Dollars, except Earnings per Share)
Sales revenue.
$210,00o
125,000
Cost of goods sold
Net income .
8,300
2,600
Dividends
Earnings per share.
4.15
HI-TECH INSTRUMENTS, INc.
Balance Sheets
(Thousands of Dollars)
Dec. 31, 2020
Dec. 31, 2019
Assets
Cash
$
,300
$ 18,000
Accounts receivable (net)
Inventory.
46,000
41,000
39,500
43,700
Total Current Assets
103,800
52,600
102,700
Plant assets (net)
50,500
Other assets
15,600
13,800
Total Assets
$172,00O
$167,000
continued

Transcribed Image Text:continued from previous page
HI-TECH INSTRUMENTS, INC.
Balance Sheets
(Thousands of Dollars)
Dec. 31, 2020
Dec. 31, 2019
Liabilities and Stockholders' Equity
Notes payable-banks
Accounts payable.
$
22,500
6,000
6,000
18,700
Accrued liabilities
16,500
21,000
45,000
40,000
Total Current Liabilities
45,700
9% Bonds payable
40,000
Total Liabilities.
85,000
85,700
Common stock, $25 par value (2,000,000 shares).
Retained earnings
50,000
37,000
50,000
31,300
Total Stockholders' Equity.
87,000
81,300
Total Liabilities and Stockholders’ Equity
$172,00o
$167,00O
Industry Average Ratios for Competitors
Quick ratio
1.3
Current ratio
2.4
Accounts receivable turnover
5.9 times
Inventory turnover.
Debt-to-equity ratio.
Gross profit percentage
Profit margin.
Return on assets
3.5 times
0.73
42.8 percent
4.5 percent
7.6 percent
Expert Solution
Step 1
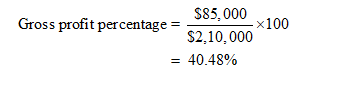
Gross profits are profits before operating expenses.
Step 2
Gross profit = Total sales – Cost of goods sold
= $2,10,000 - $1,25,000
= $85,000

Step by step
Solved in 3 steps with 2 images

Knowledge Booster


Learn more about
Need a deep-dive on the concept behind this application? Look no further. Learn more about this topic, accounting and related others by exploring similar questions and additional content below.Recommended textbooks for you

Accounting
Accounting
ISBN:
9781337272094
Author:
WARREN, Carl S., Reeve, James M., Duchac, Jonathan E.
Publisher:
Cengage Learning,

Accounting Information Systems
Accounting
ISBN:
9781337619202
Author:
Hall, James A.
Publisher:
Cengage Learning,
Accounting
Accounting
ISBN:
9781337272094
Author:
WARREN, Carl S., Reeve, James M., Duchac, Jonathan E.
Publisher:
Cengage Learning,
Accounting Information Systems
Accounting
ISBN:
9781337619202
Author:
Hall, James A.
Publisher:
Cengage Learning,

Horngren's Cost Accounting: A Managerial Emphasis…
Accounting
ISBN:
9780134475585
Author:
Srikant M. Datar, Madhav V. Rajan
Publisher:
PEARSON

Intermediate Accounting
Accounting
ISBN:
9781259722660
Author:
J. David Spiceland, Mark W. Nelson, Wayne M Thomas
Publisher:
McGraw-Hill Education

Financial and Managerial Accounting
Accounting
ISBN:
9781259726705
Author:
John J Wild, Ken W. Shaw, Barbara Chiappetta Fundamental Accounting Principles
Publisher:
McGraw-Hill Education