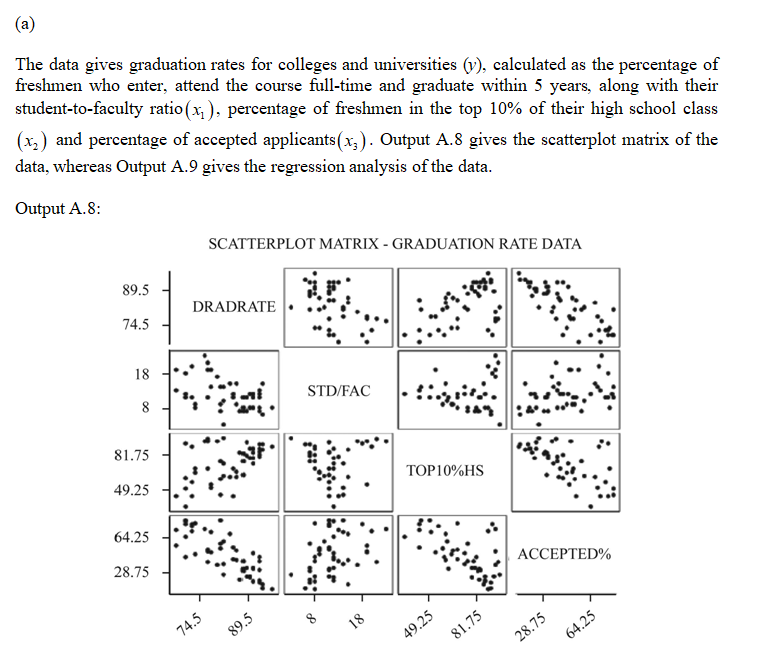
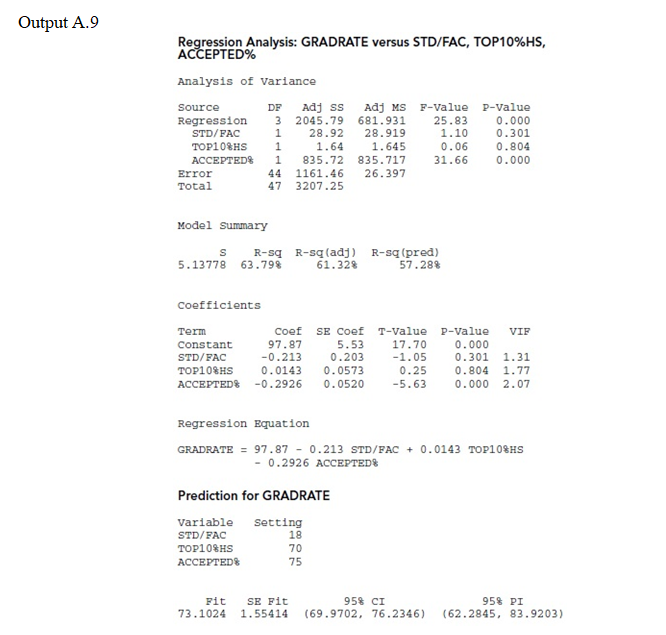
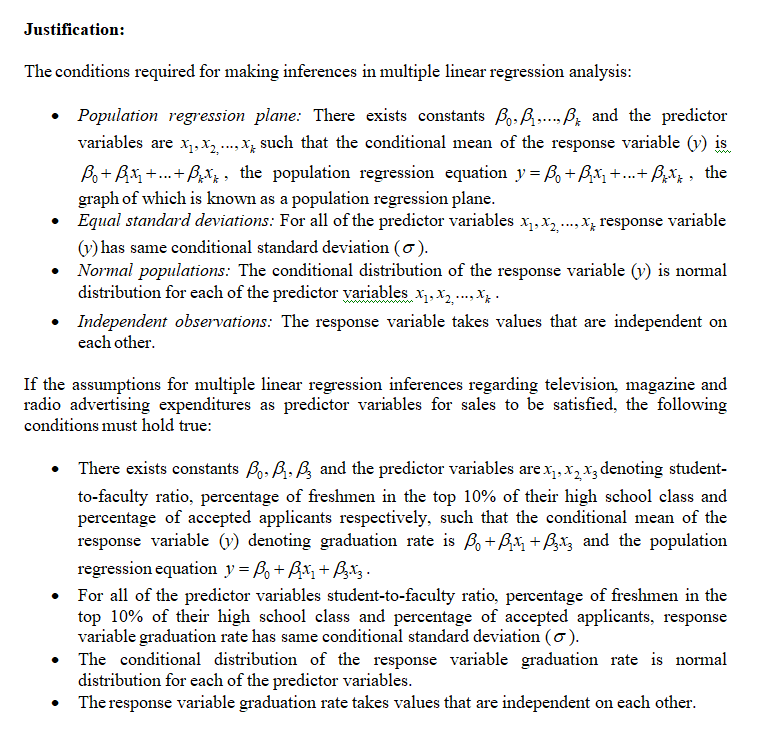
Graduation Rates. Regarding the relationship between college graduation rate and the predictor variables of student-to-faculty ratio, the percentage of freshmen in the top 10% of their high school class, and the percentage of applicants accepted. a. Explain what it would mean for the assumptions for multiple linear regression inferences to be satisfied with student-to-faculty ratio, percentage of freshmen in the top 10% of their high school class, and percentage of applicants accepted as predictor variables for graduation rate. b. Use the computer output to obtain the coefficient of determination, R2. Interpret your result. c. How useful do the variables student-to-faculty ratio, percentage of freshmen in the top 10% of their high school class, and percentage of applicants accepted appear to be for predicting graduation rates at colleges and universities? d. Determine and interpret the standard error of the estimate, se. e. At the 5% significance level, do the data provide sufficient evidence to conclude that, taken together, student-to-faculty ratio, percentage of freshmen in the top 10% of their high school class, and percentage of applicants accepted are useful for predicting graduation rate?
Correlation
Correlation defines a relationship between two independent variables. It tells the degree to which variables move in relation to each other. When two sets of data are related to each other, there is a correlation between them.
Linear Correlation
A correlation is used to determine the relationships between numerical and categorical variables. In other words, it is an indicator of how things are connected to one another. The correlation analysis is the study of how variables are related.
Regression Analysis
Regression analysis is a statistical method in which it estimates the relationship between a dependent variable and one or more independent variable. In simple terms dependent variable is called as outcome variable and independent variable is called as predictors. Regression analysis is one of the methods to find the trends in data. The independent variable used in Regression analysis is named Predictor variable. It offers data of an associated dependent variable regarding a particular outcome.
Graduation Rates. Regarding the relationship between college graduation rate and the predictor variables of student-to-faculty ratio, the percentage of freshmen in the top 10% of their high school class, and the percentage of applicants accepted.
a. Explain what it would mean for the assumptions for multiple linear regression inferences to be satisfied with student-to-faculty ratio, percentage of freshmen in the top 10% of their high school class, and percentage of applicants accepted as predictor variables for graduation rate.
b. Use the computer output to obtain the coefficient of determination, R2. Interpret your result.
c. How useful do the variables student-to-faculty ratio, percentage of freshmen in the top 10% of their high school class, and percentage of applicants accepted appear to be for predicting graduation rates at colleges and universities?
d. Determine and interpret the standard error of the estimate, se.
e. At the 5% significance level, do the data provide sufficient evidence to conclude that, taken together, student-to-faculty ratio, percentage of freshmen in the top 10% of their high school class, and percentage of applicants accepted are useful for predicting graduation rate?


Step by step
Solved in 2 steps with 6 images


