(a) The following diagram shows the movement of Kenyan households among three income groups: affluent, middle class, and poor, over the 11-year period 1980–1991. AFFLUENT 27.1% Sh72,000 (in 1994) 7.5% MIDDLE CLASS 8.5% Sh24,000 (in 1994) 30.4% POOR (i) Use the transitions shown in the diagram to construct a transition matrix (assuming zero probabilities for the transitions between affluent and poor). (ii) Assuming that the trend shown was to continue, what percent of households' classified as affluent in 1980 -1991, were predicted to become poor in 1993? (iii) According to the model, what percentage of all Kenyan households will be in each income bracket in the long term?

Advanced Engineering Mathematics
10th Edition
ISBN:9780470458365
Author:Erwin Kreyszig
Publisher:Erwin Kreyszig
Chapter2: Second-order Linear Odes
Section: Chapter Questions
Problem 1RQ
icon
Related questions
icon
Concept explainers
Question
100%
(a) The following diagram shows the movement of Kenyan households among
three income groups: affluent, middle class, and poor, over the 11-year
period 1980–1991.
AFFLUENT
27.1%
Sh72,000
(in 1994)
7.5%
MIDDLE CLASS
8.5%
Sh24,000
(in 1994)
30.4%
POOR
(i)
Use the transitions shown in the diagram to construct a transition
matrix (assuming zero probabilities for the transitions between
affluent and poor).
(ii)
Assuming that the trend shown was to continue, what percent of
households' classified as affluent in 1980 -1991, were predicted to
become poor in 1993?
(iii)
According to the model, what percentage of all Kenyan households
will be in each income bracket in the long term?
Transcribed Image Text:(a) The following diagram shows the movement of Kenyan households among three income groups: affluent, middle class, and poor, over the 11-year period 1980–1991. AFFLUENT 27.1% Sh72,000 (in 1994) 7.5% MIDDLE CLASS 8.5% Sh24,000 (in 1994) 30.4% POOR (i) Use the transitions shown in the diagram to construct a transition matrix (assuming zero probabilities for the transitions between affluent and poor). (ii) Assuming that the trend shown was to continue, what percent of households' classified as affluent in 1980 -1991, were predicted to become poor in 1993? (iii) According to the model, what percentage of all Kenyan households will be in each income bracket in the long term?
Expert Solution
trending now

Trending now

This is a popular solution!

steps

Step by step

Solved in 2 steps

Blurred answer
Follow-up Questions
Read through expert solutions to related follow-up questions below.
Follow-up Question
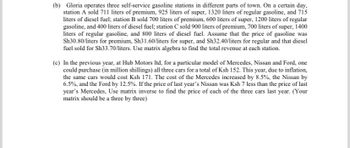
(b) Gloria operates three self-service gasoline stations in different parts of town. On a certain day,
station A sold 711 liters of premium, 925 liters of super, 1320 liters of regular gasoline, and 715
liters of diesel fuel; station B sold 700 liters of premium, 600 liters of super, 1200 liters of regular
gasoline, and 400 liters of diesel fuel; station C sold 900 liters of premium, 700 liters of super, 1400
liters of regular gasoline, and 800 liters of diesel fuel. Assume that the price of gasoline was
Sh30.80/liters for premium, Sh31.60/liters for super, and Sh32.40/liters for regular and that diesel
fuel sold for Sh33.70/liters. Use matrix algebra to find the total revenue at each station.
(c) In the previous year, at Hub Motors ltd, for a particular model of Mercedes, Nissan and Ford, one
could purchase (in million shillings) all three cars for a total of Ksh 152. This year, due to inflation,
the same cars would cost Ksh 171. The cost of the Mercedes increased by 8.5%, the Nissan by
6.5%, and the Ford by 12.5%. If the price of last year's Nissan was Ksh 7 less than the price of last
year's Mercedes, Use matrix inverse to find the price of each of the three cars last year. (Your
matrix should be a three by three)
Transcribed Image Text:(b) Gloria operates three self-service gasoline stations in different parts of town. On a certain day, station A sold 711 liters of premium, 925 liters of super, 1320 liters of regular gasoline, and 715 liters of diesel fuel; station B sold 700 liters of premium, 600 liters of super, 1200 liters of regular gasoline, and 400 liters of diesel fuel; station C sold 900 liters of premium, 700 liters of super, 1400 liters of regular gasoline, and 800 liters of diesel fuel. Assume that the price of gasoline was Sh30.80/liters for premium, Sh31.60/liters for super, and Sh32.40/liters for regular and that diesel fuel sold for Sh33.70/liters. Use matrix algebra to find the total revenue at each station. (c) In the previous year, at Hub Motors ltd, for a particular model of Mercedes, Nissan and Ford, one could purchase (in million shillings) all three cars for a total of Ksh 152. This year, due to inflation, the same cars would cost Ksh 171. The cost of the Mercedes increased by 8.5%, the Nissan by 6.5%, and the Ford by 12.5%. If the price of last year's Nissan was Ksh 7 less than the price of last year's Mercedes, Use matrix inverse to find the price of each of the three cars last year. (Your matrix should be a three by three)
Solution
Bartleby Expert
SEE SOLUTION
Knowledge Booster
Continuous Probability Distribution
Learn more about
Need a deep-dive on the concept behind this application? Look no further. Learn more about this topic, advanced-math and related others by exploring similar questions and additional content below.
Similar questions
Recommended textbooks for you
Advanced Engineering Mathematics
Advanced Math
ISBN:
9780470458365
Author:
Erwin Kreyszig
Publisher:
Wiley, John & Sons, Incorporated
Numerical Methods for Engineers
Advanced Math
ISBN:
9780073397924
Author:
Steven C. Chapra Dr., Raymond P. Canale
Publisher:
McGraw-Hill Education
Introductory Mathematics for Engineering Applicat…
Advanced Math
ISBN:
9781118141809
Author:
Nathan Klingbeil
Publisher:
WILEY
Mathematics For Machine Technology
Advanced Math
ISBN:
9781337798310
Author:
Peterson, John.
Publisher:
Cengage Learning,
Basic Technical Mathematics
Advanced Math
ISBN:
9780134437705
Author:
Washington
Publisher:
PEARSON
Topology
Topology
Advanced Math
ISBN:
9780134689517
Author:
Munkres, James R.
Publisher:
Pearson,