Gentle Ben is a Morgan horse at a Colorado dude ranch. Over the past 8 weeks, a veterinarian took the following glucose readings from this horse (in mg/100 ml). 91 90 82 103 99 108 82 89 The sample mean is x 93.0. Let x be a random variable representing glucose readings taken from Gentle Ben. We may assume that x has a normal distribution, and we know from past experience that a = 12.5. The mean glucose level for horses should be u= 85 ma/100 ml.t Do these data Indicate that Gentle Ben has an overall average glucose level higher than 85? Use a= 0.05. (a) What is the level of significance? State the null and alternate hypotheses. Will you use a left-tailed, right-talled, or two-tailed test? O Ho: H = 85; H,: H+ 85; two-tailed O Ho: H = 85; H,: H < 85; left-tailed O Ho: H = 85; H,: H> 85; right-tailed O Ho: H > 85; H: H= 85; right-tailed (b) What sampling distribution will you use? Explain the rationale for your choice of sampling distribution. O The standard normal, since we assume that x has a normal distribution with unknown a. O The Student's t, since n is large with unknown o. O The Student's t, since we assume that x has a normal distribution with known a. O The standard normal, since we assume that x has a normal distribution with known a. Compute thez value of the sample test statistic. (Round your answer to two decimal places.)
Gentle Ben is a Morgan horse at a Colorado dude ranch. Over the past 8 weeks, a veterinarian took the following glucose readings from this horse (in mg/100 ml). 91 90 82 103 99 108 82 89 The sample mean is x 93.0. Let x be a random variable representing glucose readings taken from Gentle Ben. We may assume that x has a normal distribution, and we know from past experience that a = 12.5. The mean glucose level for horses should be u= 85 ma/100 ml.t Do these data Indicate that Gentle Ben has an overall average glucose level higher than 85? Use a= 0.05. (a) What is the level of significance? State the null and alternate hypotheses. Will you use a left-tailed, right-talled, or two-tailed test? O Ho: H = 85; H,: H+ 85; two-tailed O Ho: H = 85; H,: H < 85; left-tailed O Ho: H = 85; H,: H> 85; right-tailed O Ho: H > 85; H: H= 85; right-tailed (b) What sampling distribution will you use? Explain the rationale for your choice of sampling distribution. O The standard normal, since we assume that x has a normal distribution with unknown a. O The Student's t, since n is large with unknown o. O The Student's t, since we assume that x has a normal distribution with known a. O The standard normal, since we assume that x has a normal distribution with known a. Compute thez value of the sample test statistic. (Round your answer to two decimal places.)

MATLAB: An Introduction with Applications
6th Edition
ISBN:9781119256830
Author:Amos Gilat
Publisher:Amos Gilat
Chapter1: Starting With Matlab
Section: Chapter Questions
Problem 1P

Related questions

Question
100%

Transcribed Image Text:Gentle Ben is a Morgan horse at a Colorado dude ranch. Over the past 8 weeks, a veterinarian took the following glucose readings from this horse (in mg/100 ml).
91
90
82
103
99
108
82
89
The sample mean is x = 93.0. Let x be a random variable representing glucose readings taken from Gentle Ben. We may assume that x has a normal distribution, and we know from past experience
that o = 12.5. The mean glucose level for horses should be u
85 mg/100 ml.+ Do these data indicate that Gentle Ben has an overall average glucose level higher than 85? Use a = 0.05.
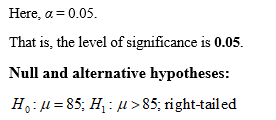
(a) What is the level of significance?
State the null and alternate hypotheses. Will you use a left-tailed, right-tailed, or two-tailed tes
O Ho: H = 85; H, : µ # 85; two-tailed
O Ho: H = 85; H,: µ < 85; left-tailed
O Ho: H = 85; H: µ > 85; right-tailed
O Ho: H> 85; H: µ = 85; right-tailed
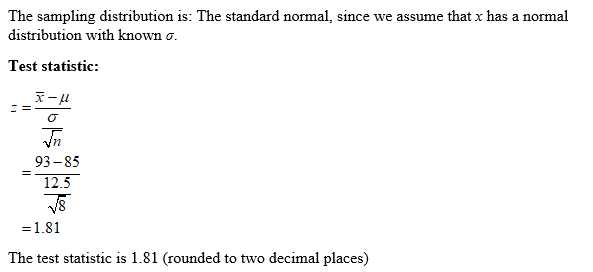
(b) What sampling distribution will you use? Explain the rationale for your choice of sampling distribution.
O The standard normal, since we assume that x has a normal distribution with unknown o.
O The Student's t, since n is large with unknown o.
O The Student's t, since we assume that x has a normal distribution with known o.
O The standard normal, since we assume that x has a normal distribution with known o.
Compute the z value of the sample test statistic. (Round your answer to two decimal places.)
(c) Find (or estimate) the P-value. (Round your answer to four decimal places.)
Expert Solution
(a) Level of significance:
(b) Sampling distribution:

Step by step
Solved in 3 steps with 3 images

Knowledge Booster


Learn more about
Need a deep-dive on the concept behind this application? Look no further. Learn more about this topic, statistics and related others by exploring similar questions and additional content below.Recommended textbooks for you
MATLAB: An Introduction with Applications
Statistics
ISBN:
9781119256830
Author:
Amos Gilat
Publisher:
John Wiley & Sons Inc

Probability and Statistics for Engineering and th…
Statistics
ISBN:
9781305251809
Author:
Jay L. Devore
Publisher:
Cengage Learning

Statistics for The Behavioral Sciences (MindTap C…
Statistics
ISBN:
9781305504912
Author:
Frederick J Gravetter, Larry B. Wallnau
Publisher:
Cengage Learning
MATLAB: An Introduction with Applications
Statistics
ISBN:
9781119256830
Author:
Amos Gilat
Publisher:
John Wiley & Sons Inc
Probability and Statistics for Engineering and th…
Statistics
ISBN:
9781305251809
Author:
Jay L. Devore
Publisher:
Cengage Learning
Statistics for The Behavioral Sciences (MindTap C…
Statistics
ISBN:
9781305504912
Author:
Frederick J Gravetter, Larry B. Wallnau
Publisher:
Cengage Learning

Elementary Statistics: Picturing the World (7th E…
Statistics
ISBN:
9780134683416
Author:
Ron Larson, Betsy Farber
Publisher:
PEARSON

The Basic Practice of Statistics
Statistics
ISBN:
9781319042578
Author:
David S. Moore, William I. Notz, Michael A. Fligner
Publisher:
W. H. Freeman

Introduction to the Practice of Statistics
Statistics
ISBN:
9781319013387
Author:
David S. Moore, George P. McCabe, Bruce A. Craig
Publisher:
W. H. Freeman