A market researcher is studying on-line subscription services. She is particularly interested in what variables relate to the number of subscriptions for a particular on-line service. She is able to obtain the following sample information on 25 on-line subscription services. The following notation is used: Sub = Number of subscriptions (in thousands) Web page hits = Average monthly count (in thousands) Adv = The advertising budget of the service (in $ hundreds) Price = Average monthly subscription price ($) Web Page Hits Web Page Hits Service Adv Price Price 35.1 Service Sub Adv Sub 586.5 544.0 35.5 34.9 13.2 14 38.39 15.4 37.95 37.66 1. 588.9 585.3 13.2 34.7 15 37.29 11.0 37.55 566.3 19.8 34.8 16 39.15 611.1 24.2 35.0 643.3 17.6 35.3 642.9 624.2 603.9 4 38.78 17.6 35.1 17 38.29 34.8 635.6 598.9 37.67 17.6 34.6 18 38.09 19.8 15.4 35.1 15.4 11.0 38.23 34.8 19 37.83 657.0 22.0 35.3 36.90 38.28 571.9 584.3 34.7 20 39.37 35.1 35.3 35.1 8. 28.6 21 37.81 595.2 15.4 520.0 629.6 35.1 35.3 9. 38.95 605.0 28.6 22 37.42 19.8 10 39.27 676.3 17.6 35.6 23 38.83 22.0 34.7 35.8 11 38.30 587.4 17.6 34.9 24 38.33 680.0 24.2 35.4 25 40.24 651.2 33.0 38.84 38.14 12 576.4 22.0 13 570.8 17.6 35.0 B Click here for the Excel Data File a. Determine the regression equation. (Negative value should be indicated with a minus sign. Round your answers to 4 decimal places.) X1 + X2 X3 b. Conduct a global test of hypothesis to determine whether any of the regression coefficients are not equal to zero. Use a = 0.05. (Round your answers to 2 decimal places.)
A market researcher is studying on-line subscription services. She is particularly interested in what variables relate to the number of subscriptions for a particular on-line service. She is able to obtain the following sample information on 25 on-line subscription services. The following notation is used: Sub = Number of subscriptions (in thousands) Web page hits = Average monthly count (in thousands) Adv = The advertising budget of the service (in $ hundreds) Price = Average monthly subscription price ($) Web Page Hits Web Page Hits Service Adv Price Price 35.1 Service Sub Adv Sub 586.5 544.0 35.5 34.9 13.2 14 38.39 15.4 37.95 37.66 1. 588.9 585.3 13.2 34.7 15 37.29 11.0 37.55 566.3 19.8 34.8 16 39.15 611.1 24.2 35.0 643.3 17.6 35.3 642.9 624.2 603.9 4 38.78 17.6 35.1 17 38.29 34.8 635.6 598.9 37.67 17.6 34.6 18 38.09 19.8 15.4 35.1 15.4 11.0 38.23 34.8 19 37.83 657.0 22.0 35.3 36.90 38.28 571.9 584.3 34.7 20 39.37 35.1 35.3 35.1 8. 28.6 21 37.81 595.2 15.4 520.0 629.6 35.1 35.3 9. 38.95 605.0 28.6 22 37.42 19.8 10 39.27 676.3 17.6 35.6 23 38.83 22.0 34.7 35.8 11 38.30 587.4 17.6 34.9 24 38.33 680.0 24.2 35.4 25 40.24 651.2 33.0 38.84 38.14 12 576.4 22.0 13 570.8 17.6 35.0 B Click here for the Excel Data File a. Determine the regression equation. (Negative value should be indicated with a minus sign. Round your answers to 4 decimal places.) X1 + X2 X3 b. Conduct a global test of hypothesis to determine whether any of the regression coefficients are not equal to zero. Use a = 0.05. (Round your answers to 2 decimal places.)

MATLAB: An Introduction with Applications
6th Edition
ISBN:9781119256830
Author:Amos Gilat
Publisher:Amos Gilat
Chapter1: Starting With Matlab
Section: Chapter Questions
Problem 1P

Related questions

Question
I need help with A and B
I have 2 hours and 30minutes to finish this

Transcribed Image Text:ere for the Excel Data File
a. Determine the regression equation. (Negative value should be indicated with a minus sign. Round your answers to 4 decimal
places.)
X2 +
X3
b. Conduct a global test of hypothesis to determine whether any of the regression coefficients are not equal to zero. Use a =
0.05. (Round your answers to 2 decimal places.)
Ho: B1 = B2 = B3 = 0
H: Not all B;'s = zero.
Reject Ho if F>
at least one
of the independent variables matter(s).
The null is
rejected
in favor of the alternative,
< Prev
5 of 10
Next >
MacBook Air
411
出

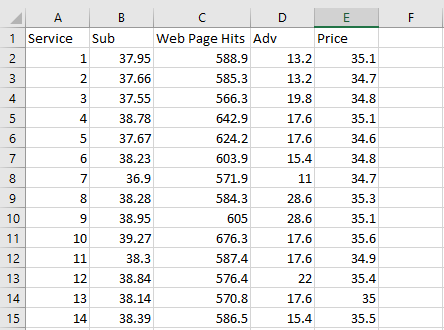
Transcribed Image Text:A market researcher is studying on-line subscription services. She is particularly interested in what variables relate to the number of
subscriptions for a particular on-line service. She is able to obtain the following sample information on 25 on-line subscription services.
The following notation is used:
Sub = Number of subscriptions (in thousands)
Web page hits = Average monthly count (in thousands)
Adv = The advertising budget of the service (in $ hundreds)
Price = Average monthly subscription price ($)
Web Page
Web Page
Hits
588.9
585.3
566.3
642.9
624.2
Service
Sub
Adv
Price
Service
Sub
Hits
Adv
Price
37.95
13.2
35.1
14
38.39
586.5
15.4
35.5
37.29
544.0
11.0
34.9
37.66
37.55
38.78
37.67
13.2
34.7
15
3
19.8
34.8
16
39.15
611.1
24.2
35.0
35.3
38.29
38.09
37.83
4
17.6
35.1
17
643.3
17.6
34.8
34.6
34.8
5.
17.6
635.6
19.8
15.4
35.1
603.9
571.9
584.3
6.
38.23
15.4
19
598.9
657.0
595.2
22.0
15.4
19.8
36.90
11.0
34.7
20
39.37
35.3
8.
38.28
28.6
35.3
21
37.81
35.1
520.0
629.6
38.95
605.0
28.6
35.1
22
37.42
35.1
22.0
24.2
35.3
34.7
38.83
676.3
587.4
10
39.27
17.6
35.6
23
38.30
17.6
34.9
24
38.33
680.0
11
40.24
651.2
33.0
35.8
35.4
35.0
12
38.84
576.4
22.0
25
13
38.14
570.8
17.6
D Click here for the Excel Data File
a. Determine the regression equation. (Negative value should be indicated with a minus sign. Round your answers to 4 decimal
places.)
X1+
X2
X3
b. Conduct a global test of hypothesis to determine whether any of the regression coefficients are not equal to zero. Use a =
0.05. (Round your answers to 2 decimal places.)
< Prev
5 of 10
Next >
MacBook
Expert Solution
Step 1
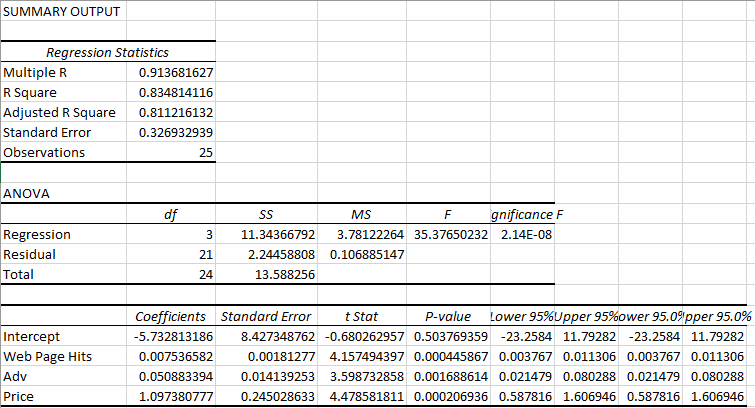
Here we use Excel to determine the regression equation. Steps to perform regression analysis in Excel;
- Enter the data into a spreadsheet
- Go to Data>Data Analysis>Regression>OK
- Select the Sub column for Y-range and Web Page Hits, Adv and Price columns for X-range.
- Check Labels>OK
- The obtained result is;

Trending now
This is a popular solution!

Step by step
Solved in 2 steps with 3 images

Knowledge Booster


Learn more about
Need a deep-dive on the concept behind this application? Look no further. Learn more about this topic, statistics and related others by exploring similar questions and additional content below.Recommended textbooks for you
MATLAB: An Introduction with Applications
Statistics
ISBN:
9781119256830
Author:
Amos Gilat
Publisher:
John Wiley & Sons Inc

Probability and Statistics for Engineering and th…
Statistics
ISBN:
9781305251809
Author:
Jay L. Devore
Publisher:
Cengage Learning

Statistics for The Behavioral Sciences (MindTap C…
Statistics
ISBN:
9781305504912
Author:
Frederick J Gravetter, Larry B. Wallnau
Publisher:
Cengage Learning
MATLAB: An Introduction with Applications
Statistics
ISBN:
9781119256830
Author:
Amos Gilat
Publisher:
John Wiley & Sons Inc
Probability and Statistics for Engineering and th…
Statistics
ISBN:
9781305251809
Author:
Jay L. Devore
Publisher:
Cengage Learning
Statistics for The Behavioral Sciences (MindTap C…
Statistics
ISBN:
9781305504912
Author:
Frederick J Gravetter, Larry B. Wallnau
Publisher:
Cengage Learning

Elementary Statistics: Picturing the World (7th E…
Statistics
ISBN:
9780134683416
Author:
Ron Larson, Betsy Farber
Publisher:
PEARSON

The Basic Practice of Statistics
Statistics
ISBN:
9781319042578
Author:
David S. Moore, William I. Notz, Michael A. Fligner
Publisher:
W. H. Freeman

Introduction to the Practice of Statistics
Statistics
ISBN:
9781319013387
Author:
David S. Moore, George P. McCabe, Bruce A. Craig
Publisher:
W. H. Freeman