g. e. The equation of the linear regression line is: ŷ - z (Please show your answers to two decimal places) h. Use the model to predict the final exam score for a student who spends 7 hours per week studying. |(Please round your answer to the nearest whole number.) Final exam score = i. Interpret the slope of the regression line in the context of the question: Select an answer j. Interpret the y-intercept in the context of the question: Select an answer
g. e. The equation of the linear regression line is: ŷ - z (Please show your answers to two decimal places) h. Use the model to predict the final exam score for a student who spends 7 hours per week studying. |(Please round your answer to the nearest whole number.) Final exam score = i. Interpret the slope of the regression line in the context of the question: Select an answer j. Interpret the y-intercept in the context of the question: Select an answer

A First Course in Probability (10th Edition)
10th Edition
ISBN:9780134753119
Author:Sheldon Ross
Publisher:Sheldon Ross
Chapter1: Combinatorial Analysis
Section: Chapter Questions
Problem 1.1P: a. How many different 7-place license plates are possible if the first 2 places are for letters and...

Related questions
Question

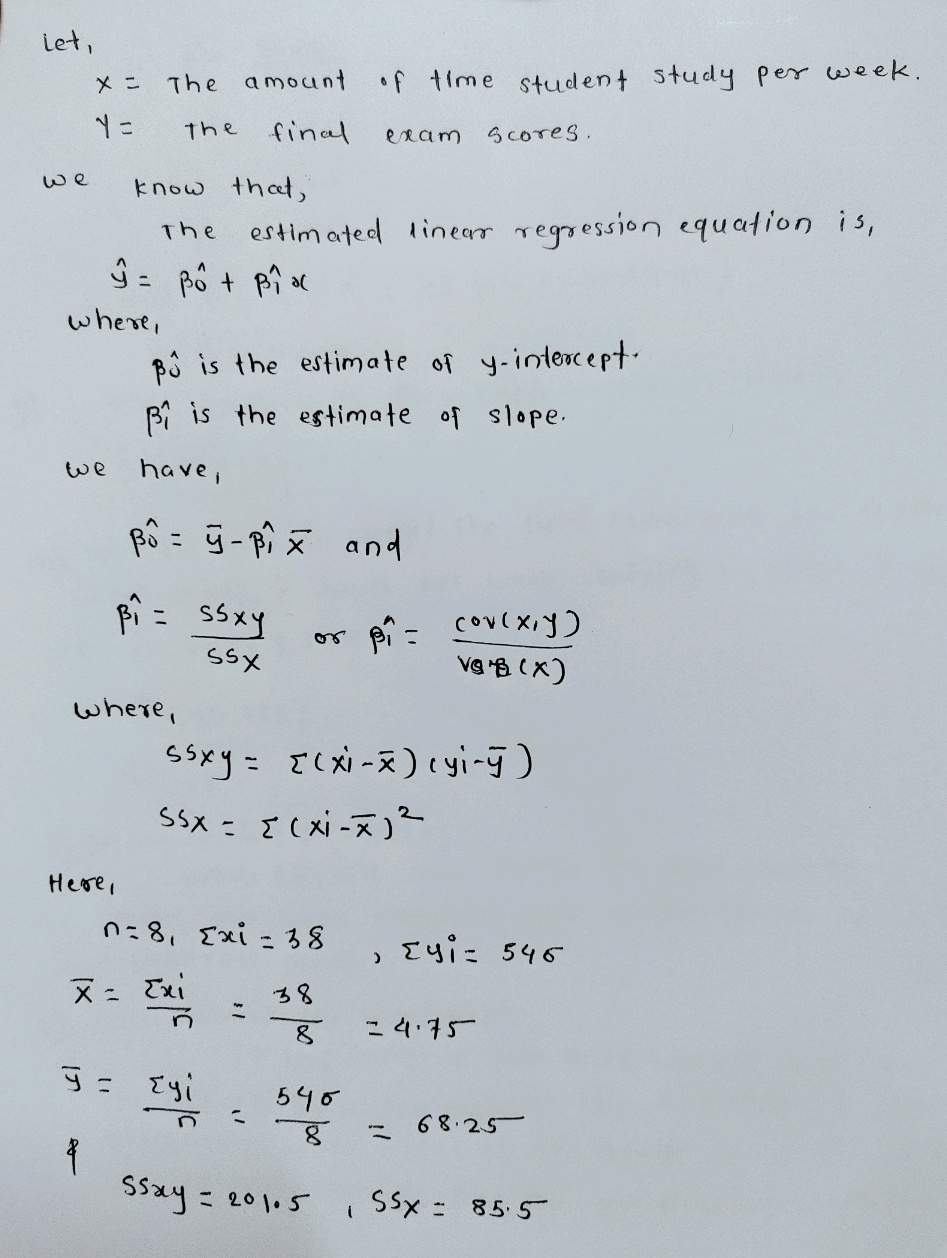
Transcribed Image Text:**Exploring the Relationship Between Study Time and Exam Scores**
### Research Question
What is the relationship between the amount of time statistics students study per week and their final exam scores? The survey results are as follows:
| Time (hours) | 11 | 5 | 7 | 1 | 2 | 7 | 4 |
|--------------|----|---|---|---|---|---|---|
| Score | 82 | 68| 70| 63| 62| 74| 78| 69 |
### Steps in Analysis
1. **Correlation Coefficient Calculation:**
- Formula: \( r = \) ______ (Round to 2 decimal places.)
2. **Hypothesis Testing:**
- Null and alternative hypotheses for correlation:
- \( H_0: \rho = 0 \)
- \( H_1: \rho \neq 0 \)
3. **P-Value Interpretation:**
- P-value: ______ (Round to four decimal places.)
4. **Hypothesis Test Conclusion:**
- Use a significance level (\( \alpha = 0.05 \)) to state your conclusion.
5. **Coefficient of Determination:**
- \( r^2 = \) ______ (Round to 2 decimal places.)
- Interpretation of \( r^2 \): __(Select an answer)__
6. **Linear Regression Equation:**
- Equation: \( \hat{y} = \) ______ + ______ \( x \) (Please show your answers to two decimal places.)
7. **Prediction Using the Model:**
- Predict the final exam score for a student studying 7 hours per week:
- Final exam score = ______ (Round to the nearest whole number.)
8. **Interpretation of the Regression Line:**
- Slope interpretation: __(Select an answer)__
- Y-intercept interpretation: __(Select an answer)__
This analysis will help determine the nature of the relationship between study time and exam scores, allowing you to make informed educational decisions based on data.
Expert Solution
Step 1

Step by step
Solved in 2 steps with 2 images

Recommended textbooks for you
A First Course in Probability (10th Edition)
Probability
ISBN:
9780134753119
Author:
Sheldon Ross
Publisher:
PEARSON

A First Course in Probability (10th Edition)
Probability
ISBN:
9780134753119
Author:
Sheldon Ross
Publisher:
PEARSON