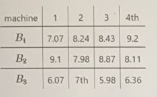
Four machines M- Mawere each made with three different components B,- Bg fitted. The average production capacities (kg KJ 8f thế macHInes wele deter meu for eacr component during a test phase. The following values were measured: machine 2 3 4th B 7.07 8.24 8.43 9.2 B2 9.1 7.98 8.87 8.11 B 6.07 7th 5.98 6.36 Determine whether there are significant differences in terms of components or machines and calculate the effect sizes. Normal distribution with the same variance can be assumed. Note: q = 14.9477, 91 = 11.0648, q3 =3.5125 Name of the test procedure: O One-way analysis of variance


Correlation
Correlation defines a relationship between two independent variables. It tells the degree to which variables move in relation to each other. When two sets of data are related to each other, there is a correlation between them.
Linear Correlation
A correlation is used to determine the relationships between numerical and categorical variables. In other words, it is an indicator of how things are connected to one another. The correlation analysis is the study of how variables are related.
Regression Analysis
Regression analysis is a statistical method in which it estimates the relationship between a dependent variable and one or more independent variable. In simple terms dependent variable is called as outcome variable and independent variable is called as predictors. Regression analysis is one of the methods to find the trends in data. The independent variable used in Regression analysis is named Predictor variable. It offers data of an associated dependent variable regarding a particular outcome.
![O There are no significant differences between the machines
O There are no very significant differences in terms of components or machines
Test variable vz:
(土0.0002
Degrees of freedom (df) = [dfj, df2]:
dfi =
(土0
df2 =
(土0
Critical valuec2:
(土0.02
Null hypothesisH2 discard:
Overall hypothesis H discard:
Overall analysis:
O There is a very significant difference; namely with regard to the machines
O There is a significant difference; namely with regard to the machines
O There is a very significant difference; namely with regard to the components
O There is a significant difference; namely with regard to the components
O There are no significant differences
O There are significant differences; namely with regard to the components and the machines
Effect strength components:
(土0.001
Effect size machines:
(土0.00)
Comment:](/v2/_next/image?url=https%3A%2F%2Fcontent.bartleby.com%2Fqna-images%2Fquestion%2F6ba2043d-be22-4e26-961a-b5d172593037%2Fc9acb9f4-badc-48a1-9f59-6923792a0ea7%2F2d0u3fa_processed.jpeg&w=3840&q=75)
![Four machines M - Mawere each made with three different components B - Bg fitted. The average production capacities [kg / h] of the machines were determined for each
component during a test phase. The following values were measured:
machine
3
4th
B
7.07 8.24 8.43
9.2
B2
9.1
7.98 8.87 8.11
6.07 7th 5.98 6.36
Determine whether there are significant differences in terms of components or machines and calculate the effect sizes, Normal distribution with the same variance can be assumed.
Note:
q = 14.9477, 1 = 11.0648, 9a =3.5125
Name of the test procedure:
O One-way analysis of variance
Ot-test for independent samples with homogeneous variances
O Two-factor analysis of variance with repeated measures
O Two-factor analysis of variance without repetition of measurements
Significance level:
O 0.5
O 0.05
O 0.01
Overall hypothesis H:
O There are no significant differences in terms of components and machines
O There are no significant differences in terms of components or machines
O There are no very significant differences in terms of the components and the machine
O There are no significant differences between the machines](/v2/_next/image?url=https%3A%2F%2Fcontent.bartleby.com%2Fqna-images%2Fquestion%2F6ba2043d-be22-4e26-961a-b5d172593037%2Fc9acb9f4-badc-48a1-9f59-6923792a0ea7%2Fey3vov_processed.jpeg&w=3840&q=75)
Hi! Thank you for the question, As per the honour code, we are allowed to answer three sub-parts at a time so we are answering the first three as you have not mentioned which of these you are looking for. Please re-submit the question separately for the remaining sub-parts.
Given :

Step by step
Solved in 4 steps with 1 images


