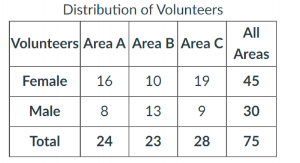
For cleaning up after the wildfire, 75 volunteers are randomly dispatched to three areas. The following table shows their assignments. Distribution of Volunteers Volunteers Area A Area B Area C Female 16 10 19 Male 8 13 9 24 23 28 Total All Areas 45 30 75
Q: s fishing better from a boat or from the shore? Pyramid Lake is located on the Paiute Indian…
A: B A d 1.5 1.6 -0.1 1.9 1.3 0.6 2.1 1.5 0.6 3.2 2.2 1 3.9 3.3 0.6 3.6 3 0.6…
Q: work fewer volunteer hours on average than sorority sisters? The data below show the number of…
A: Members of fraternities and sororities are required to volunteer for community service. The data…
Q: a. Arrange numbers using the array method and stem-and-leaf diagram b. Construct the frequency…
A: a) Arranging the numbers in ascending array : 27, 27, 27, 28, 29, 29, 30, 31, 33, 33, 33, 34, 35,…
Q: b) Find the value of the chi-square statistic for the sample. (Round the expected frequencies to…
A: Percentage O E (O-E)^2 (O-E)^2/E 0.32 270 284.16 200.5056 0.70561 0.25 229 222 49 0.22072 0.2…
Q: A company wants to study the effects a new drug has on alleviating pain. Some patients at doctor’s…
A: A population is a umiverse of all possible data for a specified object. And, sample is a selection…
Q: e director of library services at a college did a survey of types of books (by subject) in the…
A: Subject Area % Observerd Expected (O-E)^2 (O-E)^2/E Business 32% 299 284.16 220.2256 0.775006…
Q: The cumulative number of AIDS cases reported for a county is broken down by ethnicity as in the…
A: The cumulative number of AIDS cases reported for a county is broken down by ethnicity as in the…
Q: The following items represent the number of birds observed at a given feeder over the past several…
A: From the provided information, The data values are as follow: 38, 76, 41, 56, 70, 65, 55, 31, 65,…
Q: Is fishing better from a boat or from the shore? Pyramid Lake is located on the Paiute Indian…
A:
Q: c. Complete the following table. (Round fe to 1 decimal place. Round (fo - fe)2/fe to 3 decimal…
A: Given that,The data shows the number of candies purchased.The percentage of each color in the…
Q: A survey among the workers in a large manufacturing company was taken, in order to find out from…
A: A chi-square test of independence can be used to test whether two categorical variables are…
Q: The table of data obtained from WWW.BASEBALL-ALMANAC.COM shows hit information for four well known…
A: Event is the all possible outcome of the experiment. If an event is already occurred and based on…
Q: 2. In a mountainous tourist destination, a lady sells slippers. Her assistant recorded monthly…
A: Since you have posted a question with multiple sub-parts, we will solve first three sub-parts for…
Q: he director of library services at a college did a survey of types of books (by subject) in the…
A: The sampling distribution is used in the problem is, chi square.
Q: Four fish caught in the San Antonio river had the following lengths; 15cm, 11cm, 12cm, and 18cm.…
A: Given lengths,15, 11, 12, 18sample size (n)=4
Q: A newborn unit records the following data for June: Bassinet count 26 IP service day total 488…
A: The newborn unit records the following data for June are as follows: Bassinet count =26 IP service…
Q: The International League of Triple-A minor league baseball consists of 14 teams organized into three…
A: Given Information: Consider the given dataset: Team Name Division W L PCT Attendance Buffalo…
Q: A used car dealership categorizes its salespeople by the numbers of cars sold per year, with the…
A:
Q: Jll asked some randomly selected students whether they preferred blue, green, or other colors. She…
A: The two-way frequency table is, Preferred color Gender Green Blue Other Total Girl…
Q: 6 7 8 9 10 11 12 13 14 15 16 17 18 19 20 data
A: The five number summary of a set of data that consist of i) The minimum ii) First quartile(Q1) iii)…
Q: Two psychologists surveyed 562 children in grades 4, 5 and 6 in elementary schools in Michigan. They…
A: Grades Popular sports Total Boy 120 67 87 274 Girl 151 121 33 305 Total 271 188 120 579
Q: Step 3: Find the p-value of the point estimate. First identify the ohserved andlexpected values
A: Step 3: From the given information, Ethnicity Observed values(O) Proportion(p) Expected…
Q: e sizes of four samples vary as follows: Sample A, N = 100 Sample B, N = 76 Sample C, N =1000
A: Given data, Sample A, N = 100 Sample B, N = 76 Sample C, N =1000 Sample D, N = 150 Which sample will…
Q: debate? Answer in exact fract places d. What proportio are not in juniors Answer in exact fracti
A: c) P( Freshman prefer debate ) = 14/88 = 0.1591 d) P( students who prefer sports are not in…
Q: A dotplot for the distribution of the number of drinks per week of 10 randomly-selcte adults is…
A: It is given that the data set from the dotplot is:0, 1, 3, 3, 3, 4, 5, 6, 6, 9
Q: Use the following area diagram: Y N N N Y N Y Y Y Y If 120 students are surveyed concerning their…
A: Given: Area diagram
Q: Several years ago, two companies merged. One of the concerns after the merger was the increasing…
A: Hey there! Thank you for posting the question. Since your question has more than 3 parts, we are…
Q: The table below shows the data from a past United States census. Complete parts (a) and (b) below.…
A:
Q: Students apply for admission to different academic programs within a college. Because of space, each…
A: Given that ; A 2× 2 contigency table. No. Of rejected students = 68 No. Of accepted students = 18…
Q: The age of a patient at the time of diagnosis of colon cancer was tracked—50 males and 50 females.…
A: Introduction: The pth percentile of a set of observations is the value below which, p% of the…
Q: The International League of Triple-A minor league baseball consists of 14 teams organized into three…
A:
Q: The percentage of each ethnic group in a certain county is as in the following table. Ethnic…
A: Chi square test follows chi square distribution. It test whether there is any relationship between…
Q: How got the answer in that column 40 and to 30% percentage
A: Given:
Q: Scott surveyed 40 friends on Facebook and asked them where they were born and where they went to…
A:
Q: 215 285 500 b. Use the study results to complete the following. Round your answer to the…
A: Answer Giventhat: Total number of adults=500
Q: The International League of Triple-A minor league baseball consists of 14 teams organized into three…
A: Given data
Q: . A. Ventura is interested in determining what kinds and how many pets people own in Bakersfield. He…
A: Provided information is, Dr. A. Ventura is interested in determining what kinds and how many pets…
Q: 2) The following table shows three different airlines and the number of delayed or on-time flights…
A: We have given table for the three different airlines and the number of delayed or on time…
Q: U.S. Electoral College
A:
Q: ercent of Books on Subject in Circulation Library on This Subject Number of Books in Sample on This…
A: The data given for the results is listed below Subject Area Percent of Books on Subject in…
Trending now
This is a popular solution!
Step by step
Solved in 7 steps with 2 images
- Virginia polled a large sample of individuals to find the percentage of students with known food allergies and the percentage of students without known food allergies. Which of the following could sufficiently display the data if only the two given categories are to be included? Select the correct answer below: bar graph pie chart either a pie chart or a bar graph neither a pie chart nor a bar graphThe table shows the price and number of pieces sold for a total of three products. Use the Laspeyres composite index to find out how the number of pieces sold before Christmas has changed compared to November. number of pieces price product NovemberDecemberNovemberDecember 1 98 112 105 125 2 131 275 159 100 3 95 114 110 100 а. 1,27 b. 1,64 с. 1,52 d. 0,84 Zrušit mou volbuRBI Kings. As reported on MLB.com, the five players with the highest runs batted in (RBI) during the 2012 Major League Baseball season are listed in the following table. Also included are the teams for which they played, their positions, and their weights. Identify the type of data provided by the information in each column of the table. Player Team Position RBI Weight (lb) M. Cabrera Detroit 3B 139 240 J. Hamilton Texas LE 128 225 C. Headley San Diego 3B 115 220 R. Braun Milwaukee LE 112 205 E. Encamacion Toronto IB 110 230
- On the following pages you are presented with five problems. Your job is to examine the output and discuss whether there is a statistically significant relationship between the two variables, the pattern or direction of the relationship if the relationship is significant, and the strength of the relationship if the relationship is significant. AS you discuss the strength of the relationship, you will rely on an appropriate measure of association from those that have been given. For that determination, you will need to appropriately determine the level of measurement of each of the variables being examined. Please use the Measures of Association Chart I provided to help you with your determination. You may write your responses on a separate document or next to the problems on this one.Table 1: Birds counted at a New Jersey Wildlife Conservation Park Bird Species Ruby Throated Hummingbird House Sparrow Purple Martin Count Spring Summer Winter 21 32 0 21 19 14 3 25 21The director of library services at a college did a survey of types of books (by subject) in the circulation library. Then she used library records to take a random sample of 888 books checked out last term and classified the books in the sample by subject. The results are shown below. Subject Area Percent of Books on Subject in CirculationLibrary on This Subject Number of Books inSample on This Subject Business 32% 284 Humanities 25% 218 Natural Science 20% 207 Social Science 15% 102 All other subjects 8% 77 (b) Find the value of the chi-square statistic for the sample. (Round the expected frequencies to three decimal places. Round the test statistic to three decimal places.)
- The director of library services at a college did a survey of types of books (by subject) in the circulation library. Then she used library records to take a random sample of 888 books checked out last term and classified the books in the sample by subject. The results are shown below. Subject Area Percent of Books on Subject in CirculationLibrary on This Subject Number of Books inSample on This Subject Business 32% 237 Humanities 25% 220 Natural Science 20% 223 Social Science 15% 128 All other subjects 8% 80 Using a 5% level of significance, test the claim that the subject distribution of books in the library fits the distribution of books checked out by students. (a) What is the level of significance?State the null and alternate hypotheses. H0: The distributions are the same.H1: The distributions are different.H0: The distributions are the same.H1: The distributions are the same. H0: The distributions are different.H1: The distributions are different.H0: The…A manufacturing plant makes computer chips 24 hours a day. Employees work one of three, 8 hour shifts during the morning (2am-10am), day (10am-6pm), and night (6pm-2am). Below are data on the number of defective chips on a randomly chosen 24 hour period. Shift Morning Day Night Number of Defective Chips 23 26 47 Total Chips Manufactured 330 330 330 The plant manager thinks there might be more defective computer chips manufactured during the night shift compared to the day shift. Give appropriate statistical evidence to test the managers' claim.The director of library services at a college did a survey of types of books (by subject) in the circulation library. Then she used library records to take a random sample of 888 books checked out last term and classified the books in the sample by subject. The results are shown below. Subject Area Percent of Books on Subject in CirculationLibrary on This Subject Number of Books inSample on This Subject Business 32% 267 Humanities 25% 217 Natural Science 20% 222 Social Science 15% 109 All other subjects 8% 73 Using a 5% level of significance, test the claim that the subject distribution of books in the library fits the distribution of books checked out by students. (a) What is the level of significance?State the null and alternate hypotheses. H0: The distributions are different.H1: The distributions are the same.H0: The distributions are the same.H1: The distributions are different. H0: The distributions are the same.H1: The distributions are the same.H0: The…
- Darius surveyed 16 students and recorded the following data: 25 46 61 52 30 47 32 28 50 52 23 37 40 45 39 29 Construct stem-and-lead diagram: 21 31 41 51 61 ہےcomplaint and, if so, whether the complaint was medical or nonmedical in nature. After a year, a tally from these patients was collected to count number who left the HMO voluntarily. Here are the data on the total number in each group and the number who voluntarily left the HMO: No complaint Medical complaint Nonmedical complaint Total A certain health maintenance organization (HMO) wishes to study why patients leave the HMO. A SRS of 423 patients was taken. Data was collected on whether a patient had filed a 177 111 135 Left 64 27 50 If the null hypothesis is Ho : pı = P2 = P3 and using a = 0.05, then do the following: (a) Find the expected number of people with no complaint who leave the HMO: (b) Find the expected number of people with a medical complaint who leave the HMO: (c) Find the expected number of people with a nonmedical complaint who leave the HMO: (d) Find the test statistic: (e) Find the degrees of freedom: (f) Find the critical value: (g) The final conclusion is OA. We…The director of library services at a college did a survey of types of books (by subject) in the circulation library. Then she used library records to take a random sample of 888 books checked out last term and classified the books in the sample by subject. The results are shown below. Subject Area Percent of Books on Subject in CirculationLibrary on This Subject Number of Books inSample on This Subject Business 32% 259 Humanities 25% 223 Natural Science 20% 213 Social Science 15% 126 All other subjects 8% 67 Using a 5% level of significance, test the claim that the subject distribution of books in the library fits the distribution of books checked out by students. (a) What is the level of significance?State the null and alternate hypotheses. H0: The distributions are different.H1: The distributions are the same.H0: The distributions are the same.H1: The distributions are the same. H0: The distributions are different.H1: The distributions are different.H0: The…