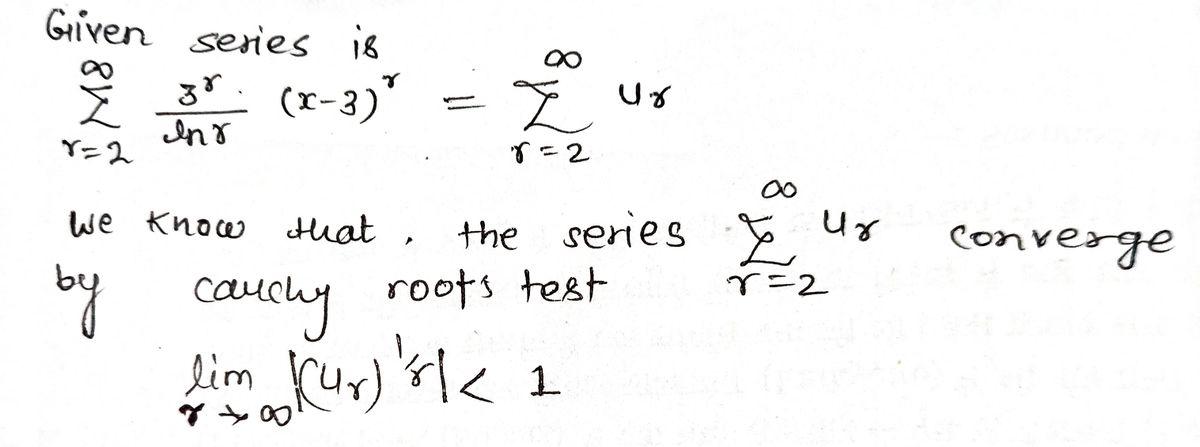
Find the interval of convergence of the power series :(x – 3)" Inr
Q: Omitting a relevant variable(s) from a model dangerous than including an irrelevant variable(s). Do…
A: The ordinary least squares regression gives unbiased estimates with smallest variance of all…
Q: How many independent variables are there in simple linear regression analysis? 1 2…
A: The estimated model for a simple linear regression analysis is y=α+βx, where y is the dependent…
Q: What concepts can you learn in simple linear regression? Cite at least three techniques in solving…
A: From te given information we find the solution.
Q: Regression analysis can be used to establish cause-and-effect relationships between variables. O…
A:
Q: Q=What do you mean by “goodness-of-fit” in regression analysis; how it is determined in linear…
A: The goodness of fit test is a statistical hypothesis test to see how well sample data fit a…
Q: strengths and criticisms of the scientific method in research
A: The scientific method is one of the ways of conducting research.
Q: With step by steps pls Provide one example like situation or problem then apply the concept of…
A: The table below shows the number of state-registered automatic weapons and the murder rate for…
Q: How can categorical or quantitative variables relate to the real world?
A: A Quantitative variable is the one who has a numerical significance attached to it like the quantity…
Q: Solve the normal equations and give an estimate of the intercept parameter, 60. Round your final…
A: Here the dependent variable is electricity usage.The independent variable is the production.Given…
Q: True or False and why? Explain. Using linearization we can estimate : (1.003)2(1.001)4 is…
A: Linearization of a function f(x,y) about a point (a, b) is given by
Q: About the Hubble Space Telescope by NASA and STScI (adapted excerpt) Orbiting 360 miles above Earth,…
A: The objective of the question is to identify the central idea of the passage about the Hubble Space…
Q: Can the multiple regression test be conducted using nominal and ordinal data? Give an explanation…
A: Ordinal regression is a member of the family of regression analyses. As a predictive analysis,…
Q: Scenario: Does studying with background music (X) improve test scores (Y)? Students self-reported…
A: Here's Y is the dependent variable (improve test scores).
Q: The slope of a regression equation indicates where the regression line will cross the y-axis.
A: Introduction: Slope of a regression equation indicates the steepness of the regression line. The…
Q: Considering two variables in a regression equation = 1 125 + 0 375x The incorrect statement is 1 The…
A: Provided regression equation is: ŷ=1.125+0.325x It is of the form, y=β0+β1x where, β0 is intercept,…
Q: Wages ($) 50-100 No. of Workers X No. of Workers Y 2 6. 100-150 11 150-200 29 18 200-250 54 32…
A: Introduction: Variance: Variance is one of the types of measures of dispersion. The variance is…
Q: A researcher wants to test the relationship between the number of years of formal education received…
A:
Q: what do they not show/tell us about the data in the picture. What additional questions does it make…
A: Based on data gathered from the sources Suppose the information as shown by Spreadsheet with…
Q: A negative relationship between two variables means: Group of answer choices The two variables are…
A: Introduction:Type of relationship between two variables (in terms of direction):Positive…
Q: What is the slope of the line -What is the intercept of the line -What is the regression equation
A: Two points that exactly pass through the given line can be approximated from the graph as (9.1,…
Q: Correlation and Regression: 7) Is there a relationship between how much cheese we eat and how…
A: hello thank you for the question. According to our honor code can answer only three sub parts at a…
Q: Explain the following: Dependent Variable Independent variable Moderating variable You can…
A: Dependent variable refers to the variable that we test or measure in an experiment. The value of…
Q: The computer output (below) shows a relationship where Y = Sale price for a home, X1 = living area,…
A:
Q: More information on the regression equation that is presented
A: The general simple linear regression equation is given as:and we have given a regression equation as…
Q: Explain with the aid of an example the concept depicted in the Include all 3 different use cases in…
A: Let us take an example where thee stress and strength the two physical qualities of a material are…
Q: Can you help with this question please!
A: Step 1:Need for Subjective Factors (or) Qualitative Variables in RegressionSubjective factors,…
Q: About the Hubble Space Telescope by NASA and STScI (adapted excerpt) Orbiting 360 miles above Earth,…
A: The objective of the question is to identify the central idea of the passage about the Hubble Space…
Q: Obs. 1 2 3 4 6 7 8 9 10 00 Xu X 5 s LD 00 6 14 55 12 15 16 16 19 Y 23 16 25 ~~ 28 13 51 37 51 51 788…
A: The following given formulas are used to calculate the desired entities: β^1=Covx,yVarx…
Q: Use whatever information from the regression models in question #1 that you think is necessary to…
A: Given Information: There are given two regression models fitted for determining whether homicide…
Q: a regression analysis on a set of data (with two variables, X and Y) outcomes a value of r-square =…
A:
Q: The functions g(b, c, d) and h(b, c, d) are defined as: g = (b+ c+ d')' + (b' + c' + d') · (b' . c'…
A:
Q: TOPIC 1 TWO-STEP EXPRESSIONS AND EQUATIONS SKILLS PRACTICE continued 7 A submarine is diving at a…
A:
Q: Based on the regression equation, we can Multiple Choice measure cause and effect predict the value…
A: Let us assume the regression line : Y =a+bX Y is the dependent variable X is the independent…
Q: X Y Stress…
A: Calculations Regression equation : y= 2.833 x - 4.16667
Q: 10- 00 Sleep time A 9 2 0 O Both negative and linear O Positive 2 Number of Caffeinated Beverages…
A: A scatterplot is a graphical representation which helps in understanding the relationship b/w the 2…
Step by step
Solved in 2 steps with 2 images
- can you help me explain the diagramIn-text Activities: Firm-Up/Deepen Activities A relationship between two variables in such a way that one quantity increases or decreases the other quantity also increases or decreases in a definite way is called a variation. Direct variation indicates that when.. x (independent variable) increases, y (dependent variable) also increases x (independent variable) decreases, y (dependent variable) also decreases Graphically speaking, we can present direct variation 14마 (4 hrs, 120 mil Mathematically speaking, we can denote direct variation in the equation. y = kx where x is the independent variable y is the dependent variable k is the constant 3 3 hrs, 90 miles) (2 hrs, 60 miles) 2아 (I hr, 30 miles) Verbally speaking, we can denote y = kx on the ff equivalent statements "y varies directly as x" "y varies as x" "y varies with x" "y is proportional to x' "y is directly proportional to x" As the number of hours increases, the distance increases. distance = dependent h varies directly as d…How much should a healthy Shetland pony weigh? Let x be the age of the pony (in months), and let y be the average weight of the pony (in kilograms). x 3 6 12 20 26 y 60 95 140 160 189 (a) Make a scatter diagram of the data and visualize the line you think best fits the data. Flash Player version 10 or higher is required for this question. You can get Flash Player free from Adobe's website. (b) Would you say the correlation is low, moderate, or strong? low moderate strong Would you say the correlation is positive or negative? positive negative (c) Use a calculator to verify that x = 67, x2 = 1265, y = 644, y2 = 93,546, and xy = 10,544. Compute r. (Round your answer to three decimal places.) As x increases from 3 to 26 months, does the value of r imply that y should tend to increase or decrease? Explain your answer. Given our value of r, y should…
- Any help with any of the questions is appreciated thank you!Linear Modeling 1. Some phone apps measure the number of steps taken during a period of time. John downloaded an app that reported data in a table like this: Time Steps Steps taken taken (minutes) 600 4000 20 2400 25 3000 4200 3000 35 2000 1000 10 20 30 40 Minutes (a) What are the variables of the problem? Identify independent and/or dependent variables of the problem if any. (b) Use the information from the table to graph the number of steps that John has taken over time. Connect the points on your graph. Does this curve or is it a line? (c) Explain why the graph tells you that John is walking at a constant pace. МacВook Air DII DD 80 F10 F9 F6 F7 F8 F5 F2 F3 F4 & 23 2$ 3 4 5 6. 7 8 9. E R Y U F H J K L. * 00Question #1
- TOPIC: Linear Regression please answer, will upvote your solutions.Using R-Studio, estimate a regression equation to determine the effect of the real interest rates, the exchange rate and the GDP growth rate on the Merchandise trade (% of GDP). (All codes and regression output should be provided). NOTE: R-Studio should only be used for obtaining the regression output and the regression equation. (i) Write down the regression equation. Year Merchandise trade (% of GDP) Real interest rates (%), GDP growth (annual %) Official exchange rate (per US$). 2000 150.28 10.05 -1.4 182.43 2001 149.12 16.63 2.3 187.32 2002 144.60 13.36 1.1 190.67 2003 146.56 9.81 -0.6 193.88 2004 157.91 7.27 1.6 198.31 2005 162.57 6.42 -2 199.88 2006 62.06 -58.33 5.1 200.19 2007 63.64 5.91 7.2 202.35 2008…2. How do you identify which variable in a study is the factor? How do you identify the levels of a factor? How do you identify the dependent variable?