Find the expected count and the contribution to the chi-square statistic for the (Control, Disagree) cell in the two-way table below. Strongly Strongly Agree Neutral Disagree Agree Disagree Control 36 46 17 9. Treatment 57 42 10 3 1 Round your answer for the excepted count to one decimal place, and your answer for the contribution to the chi-square statistic to three decimal places. Expected count - i contribution to the chi-square statistic -
Find the expected count and the contribution to the chi-square statistic for the (Control, Disagree) cell in the two-way table below. Strongly Strongly Agree Neutral Disagree Agree Disagree Control 36 46 17 9. Treatment 57 42 10 3 1 Round your answer for the excepted count to one decimal place, and your answer for the contribution to the chi-square statistic to three decimal places. Expected count - i contribution to the chi-square statistic -

MATLAB: An Introduction with Applications
6th Edition
ISBN:9781119256830
Author:Amos Gilat
Publisher:Amos Gilat
Chapter1: Starting With Matlab
Section: Chapter Questions
Problem 1P

Related questions
Question
![**Chi-Square Analysis: Educational Example**
Find the expected count and the contribution to the chi-square statistic for the (Control, Disagree) cell in the two-way table below.
| | Strongly Agree | Agree | Neutral | Disagree | Strongly Disagree |
|------------|----------------|-------|---------|----------|-------------------|
| Control | 36 | 45 | 5 | 17 | 9 |
| Treatment | 57 | 42 | 10 | 3 | 1 |
**Instructions:**
1. Round your answer for the expected count to one decimal place, and your answer for the contribution to the chi-square statistic to three decimal places.
- **Expected count =** [Input box]
- **Contribution to the chi-square statistic =** [Input box]
**Resources:**
- **eTextbook and Media**: [Link to access additional resources and media]
- **Hint**: [Additional help]
**Submission:**
- You have 0 of 3 attempts used.
- [Save for Later button]
- [Submit Answer button]](/v2/_next/image?url=https%3A%2F%2Fcontent.bartleby.com%2Fqna-images%2Fquestion%2F1e13cb5e-8798-40c9-8488-bb1bc3764ba2%2F2fe9e5d8-5cfd-442b-9f77-6fd9e5b61d3b%2Fmqt3kp_processed.jpeg&w=3840&q=75)
Transcribed Image Text:**Chi-Square Analysis: Educational Example**
Find the expected count and the contribution to the chi-square statistic for the (Control, Disagree) cell in the two-way table below.
| | Strongly Agree | Agree | Neutral | Disagree | Strongly Disagree |
|------------|----------------|-------|---------|----------|-------------------|
| Control | 36 | 45 | 5 | 17 | 9 |
| Treatment | 57 | 42 | 10 | 3 | 1 |
**Instructions:**
1. Round your answer for the expected count to one decimal place, and your answer for the contribution to the chi-square statistic to three decimal places.
- **Expected count =** [Input box]
- **Contribution to the chi-square statistic =** [Input box]
**Resources:**
- **eTextbook and Media**: [Link to access additional resources and media]
- **Hint**: [Additional help]
**Submission:**
- You have 0 of 3 attempts used.
- [Save for Later button]
- [Submit Answer button]
Expert Solution
Step 1
Obtain the expected count for the cell (Control, Disagree).
The expected count for the cell (Control, Disagree) is obtained below as follows:
The formula to find the Expected frequency is,
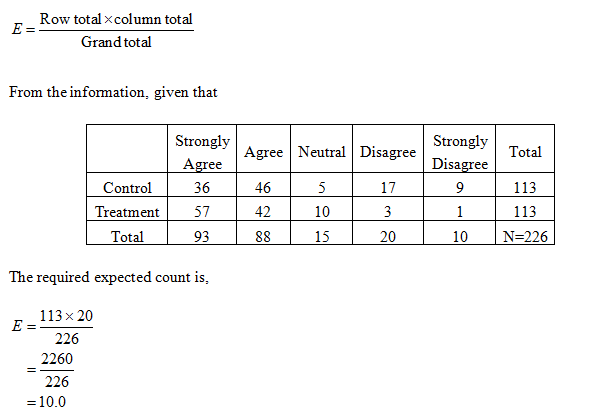
The expected count for the cell (Control, Disagree) is 10.0.

Step by step
Solved in 2 steps with 2 images

Recommended textbooks for you
MATLAB: An Introduction with Applications
Statistics
ISBN:
9781119256830
Author:
Amos Gilat
Publisher:
John Wiley & Sons Inc

Probability and Statistics for Engineering and th…
Statistics
ISBN:
9781305251809
Author:
Jay L. Devore
Publisher:
Cengage Learning

Statistics for The Behavioral Sciences (MindTap C…
Statistics
ISBN:
9781305504912
Author:
Frederick J Gravetter, Larry B. Wallnau
Publisher:
Cengage Learning
MATLAB: An Introduction with Applications
Statistics
ISBN:
9781119256830
Author:
Amos Gilat
Publisher:
John Wiley & Sons Inc
Probability and Statistics for Engineering and th…
Statistics
ISBN:
9781305251809
Author:
Jay L. Devore
Publisher:
Cengage Learning
Statistics for The Behavioral Sciences (MindTap C…
Statistics
ISBN:
9781305504912
Author:
Frederick J Gravetter, Larry B. Wallnau
Publisher:
Cengage Learning

Elementary Statistics: Picturing the World (7th E…
Statistics
ISBN:
9780134683416
Author:
Ron Larson, Betsy Farber
Publisher:
PEARSON

The Basic Practice of Statistics
Statistics
ISBN:
9781319042578
Author:
David S. Moore, William I. Notz, Michael A. Fligner
Publisher:
W. H. Freeman

Introduction to the Practice of Statistics
Statistics
ISBN:
9781319013387
Author:
David S. Moore, George P. McCabe, Bruce A. Craig
Publisher:
W. H. Freeman