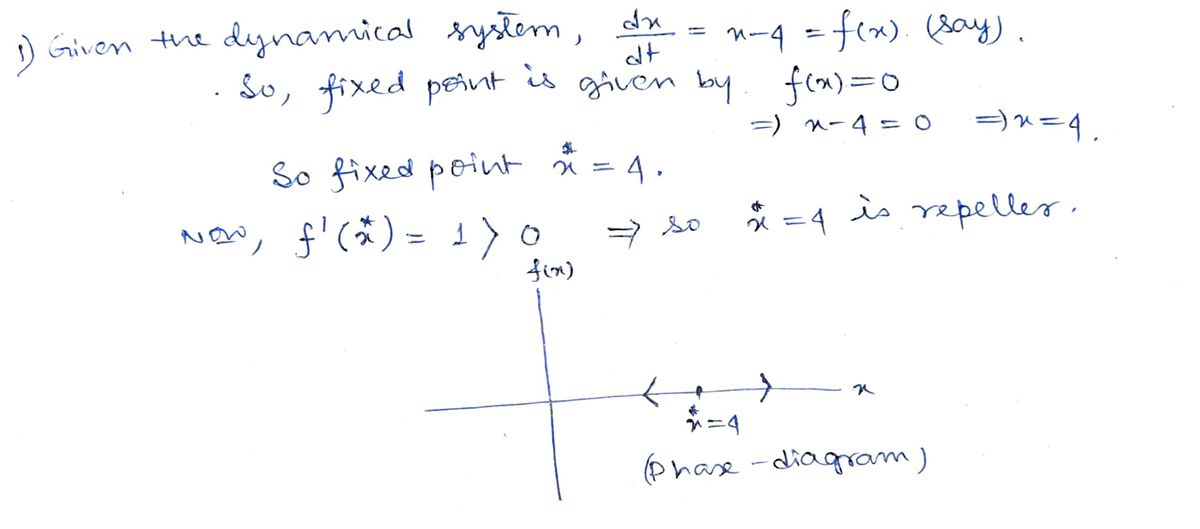
Find the equilibrium solutions and analyze the stability using the phase diagram.
Q: Consider the first-order multiple regression model with two quantitative predictors,…
A: It is an important part of statistics. It is widely used.
Q: Question 4: Trying to determine the number of students to accept is a tricky task for universities.…
A:
Q: 1- For the non-linear ODE,determine the stability properties of all the equilibrium points.
A: Solution:-
Q: The U.S. government's focus on supply reduction efforts in its "war on drugs" has been relatively…
A: 1. Answer: It has been provided that government succeeds in its efforts to reduce demand . Given the…
Q: plot phase portrait of the following ५ x = 292 - 942 = x₂ = -29²-9₂2₂ following Nonlinear system
A:
Q: For the following systems, find th
A: “Since you have posted a question with multiple sub-parts, we will solve the first three sub-parts…
Q: dz dt dp dt 2x - x² - xp = p² - z²p
A:
Q: Identify equilibrium values and determine which are stable and which are unstable. dx = y2-16 Oy -4…
A: Given Identify equilibrium values and determine which are stable and which are unstable. dy/dx=…
Q: 5. 2 x' = 3 х, 1 x(0) = 1
A: In this question, we have to find the general solution of the differential equation and draw the…
Q: Exercise # 3 A water-drive oil reservoir has the following data: Time (days) Average pHoc (psia) W.…
A: According to Schitthuis' Method, We=k'∑∆P ∆t Where, We: Cumulative water influx We for 1460 days,…
Q: Consider the discrete-time dynamical system y+1 = v -3y +3yt. It has three équiibria, ) M*= 1, or y'…
A:
Q: dx/dt=x(x2-4) Construct a phase-diagram of the nonlinear autonomous equation Ï. Determine the…
A: Image is attached with detailed solution.
Q: A statistical program is recommended. Consider the following data for two variables, x and y. x 22…
A: Given data: x y 22 11 24 21 26 34 30 35 35 39 40 35
Q: Bobo was obsessed with foxes. Over the course of several years, Bobo recorded fox populations on…
A: As fox population represent by sinusiodal curve,Let number of fox after t years given by y(t)= Asin…
Q: In the equation of a linear regression, Y = b¡X + bo , if b1 = -4.7 which means %3D %3D
A: Since , the regression equation is , Y=b1X+b0 Given that b1=-4.7 We want to find the correct…
Q: linearize the nonlinear system and classify the stability of the equilibrium points.
A: The objective of this question is to linearize the given nonlinear system and classify the stability…
Q: Draw nullclines and Phase portraits and specify the type of equilibrium points using phase…
A: Given: x'=x+2yy'=-5x-y To find: Points
Q: Find all equilibrium points and determine their types when C =1. *, = x2 *, = -bx, +1+ c(-1+ sat…
A: Given: x.1=x2x.2 =-bx2+1+c-1+sat0.5-x1-x2
Q: What is the stability of equilibrium points of A and B? Is the energy of B higher than A?
A: If the vector field lines converge to the point or stay close to a point at all times the point of…
Q: ht) Consider the discrete-time dynamical system Xr+1 - What is the equilibrium for this system? What…
A:
Q: fter extensive surveys, the research department of a company has determined that the supply and…
A: The equilibrium occurs where the quantity demanded is equal to the quantity supplied. The given…
Q: I am unsure how to solve the following problem: Interest rates for home mortgages have, in general,…
A: Slope: The regression coefficient(slope) corresponding to a given explanatory variable can be…
Q: Question 3 Given two time series for the year 2020: Month January February March April 0.679 May…
A:
Q: 1. Represent this situation using a graph where Lm = Amount of Labour on the market; Wm = Wage on…
A: Hey there! Thank you for posting the questions. However, you have posted 3 different questions…
Q: 2(x, – x)(Y, – ý) (d) Develop the estimated regression equation by computing the values of bo and b,…
A: Find Regression line equations from the following data, also Estimate y when x = 4 X Y 1 2 2…
Q: In the equation of a linear regression, Y = b;X + bo, if b, = -6.2 which means %3D !! a. For each…
A: Given regression equation Y=b1X + b0 and if b1=-6.2
Q: = 130 − 20x Based on the above estimated regression equation, if price is increased by 5 units, then…
A: Given : regression equation : ŷ = 130 − 20x
Q: Exercise 22. In the lecture notes we use a regression line of the form y = a + 3x to predict y from…
A: Here, the two regression lines are given as :y=α+βx and x=γ+δy. The regression lines are used to…
Q: Determine whether the following PDE is equilibrium equation or dynamical equation. ng
A: Given: ∂u∂t=∂2u∂x2+∂2u∂y2-u
Q: (a) Consider a model of market equilibrium in which the current supply of firms is a function of the…
A:
Q: A new town was incorporated in 1960. The size of the town's population was recorded every 5 years…
A: Introduction: Simple linear regression model: A simple linear regression model is given as y^ = b0…
Q: iven are five observations for two variables, x and y. x, 12 3 4 Y, 4 7s 10 14 a) Develop a scatter…
A: Solution: x y (x-x) (x-x)2 (y-y) (x-x)(y-y) 1 4 -2 4 -4 8 2 7 -1 1 -1 1 3 5 0 0 -3 0 4…
Q: d. Consider forecasting growth, Gt using an AR (2) model, where t represents quarterly growth data:…
A: Solution:
Q: V3 (9) 1 x' x(0) = V3 - 1
A:
Q: The annual expenditure for cell phones varies by the age of an individual. The average annual…
A: At what age is the yearly expenditure for cell phones the greatest .
Q: Suppose that, p* is a market equilibrium price such that Qª = Q* = Q*. So the system of equations of…
A: Consider the provided question, We have to find the derivative dQ*dθ and dp*dθ. Since , at…
Find the equilibrium solutions and analyze the stability using the phase diagram.
Step by step
Solved in 3 steps with 2 images
- Consider the web model with the supply and demand equations given by Find the intertemporal equilibrium price, and determine the equilibrium rate and its stability.Determine whether the following PDE is equilibrium equation or dynamical equation. du Ət dx² dy² а. cannot be determined b. equilibrium equation С. dynamical equationPopulation equilibria can be stable or unstable. If, when a population deviates a bit from the equilibrium value (as populations inevitably do), it tends to return to it, this is a stable equilibrium; if, however, when the population deviates from the equilibrium it tends to diverge from it even further, this is an unstable equilibrium. Think of a ball in the pocket of a snooker table versus a ball balanced on a snooker cue. Unstable equilibria are a feature of Allee effect models such as the following. dN Use a phase portrait of the autonomous equation above to determine whether the nonzero equilibria that you found in question (2) are stable or unstable. (Hint: See Section 2.1 of the text. List the equilibria according to their stability. Enter your answers as comma-separated lists. If there are no equilibria in a certain category, enter NONE.) stable N = unstable N =
- Data on the relationship between plant age and dry matter in the stalk are given in the Table. X (Age) 4 6 8 1 1 14 16 18 2 3 4 Y (Dry matter, %) 4 4 49 4 51 51 8 8 i) Express the relationship between the exhausted age and dry matter level with the regression equation (Ý = aX + b). ii) Using the obtained equation, estimate what the dry matter% of plants with a age of 22 weeks will be. iii) By drawing the skater diagram, find the correlation coefficient and interpret the found values. ii) iii)A snow shovel company forecasts demand that shows strong seasonality by quarter. The linear trend can be estimated by the equation y(t) = 1000 + 1000t. The forecasts start with t = 0, which corresponds with Q1 of 2021 (Jan - Mar). t = 1 corresponds to Q2 of 2021 (Apr - Jun) and so on. The seasonal relatives for Q1 = 1.5, Q2 = 0.5, Q3 = 1, Q4 = 2. What is the seasonalized forecast for Q2 of 2022.Data on the relationship between plant age and dry matter in the stalk are given in the Table. X (Age) 4 6 8 10 12 14 16 18 Y (Dry matter, %) 24 28 35 48 44 49 51 51 i) Express the relationship between the exhausted age and dry matter level with the regression equation (Ŷ = aX + b). ii) ii) Using the obtained equation, estimate what the dry matter% of plants with a age of 22 weeks will be. iii) iii) By drawing the skater diagram, find the correlation coefficient and interpret the found values.
- A linear regression line y = 80 + 0.2x is computed to predict the final exam score y on the basis of the first score x on the first test. Suppose Maria scores a 95 on the first test. What would be the predicted value of her score on the final exam? STEP 1: Substitute the value of the first test into the equation of the linear regression line. y = 80 + 0.2 STEP 2: Solve the equation of the linear regression line.y =Find the equilibrium points of the following nonlinear system. Find its linearization about each CP. Determine the types of equilibrium points and investigate the stability. x = x² + y² - 32 y' =y-xDerive the two expressions for the IS and LM equilibrium relationships respectively. Sketch a graph of the two relationships.
- For Shock G: Suppose the economy starts in the long run equilibrium. Illustrate changes that the shock will cause in the short run (using AD-SRAS). Explain why each curve shifts. Determine how the price level and output will be affected in the short run. Mark the output gap on the diagram. Is the output gap positive or negative? Is the economy is booming, or is it in a recession? On the same diagram illustrate how the economy will adjust to the shock in the long run and explain the mechanism. Determine how the price level and output will be affected in the long run. G. The government increases its spending on national defense As a result of this shock, in the short run the (SRAS Curve/AD Curve) will shift? In consequence, in the short run prices and output will? In the short run, there will be a ? (negative/postive) output gap,which means there will be a ? (boom/recession) As time passes, because of high unemployment the wages in the economy will? (decrease/increase) As a…The following data were obtained for the growth of a tarsier population introduced into a new environment on the island of Bohol. Plot the data. Is there a trend? Plot the change in population versus years elapsed after 1904. Formulate a discrete dynamical system that reasonably approximates the change you have observed. Year 1904 1914 1934 1944 1954 1650 1924 Population 125 275 830 1200 1750