Find the area of the shaded region under the standard normal curve. r the st n? Click here to view the standard normal table. r the s z=1.11 ..... The area of the shaded region is. (Round to four decimal places as needed.) s-and-a nder I norma ight of ces » A= stanc to the
Find the area of the shaded region under the standard normal curve. r the st n? Click here to view the standard normal table. r the s z=1.11 ..... The area of the shaded region is. (Round to four decimal places as needed.) s-and-a nder I norma ight of ces » A= stanc to the

A First Course in Probability (10th Edition)
10th Edition
ISBN:9780134753119
Author:Sheldon Ross
Publisher:Sheldon Ross
Chapter1: Combinatorial Analysis
Section: Chapter Questions
Problem 1.1P: a. How many different 7-place license plates are possible if the first 2 places are for letters and...

Related questions
Question
Answer these 2 math question. Each picture is a different math problem
![The image shows a problem statement and a diagram, which are part of an educational activity for finding the area under the standard normal curve.
**Problem Statement:**
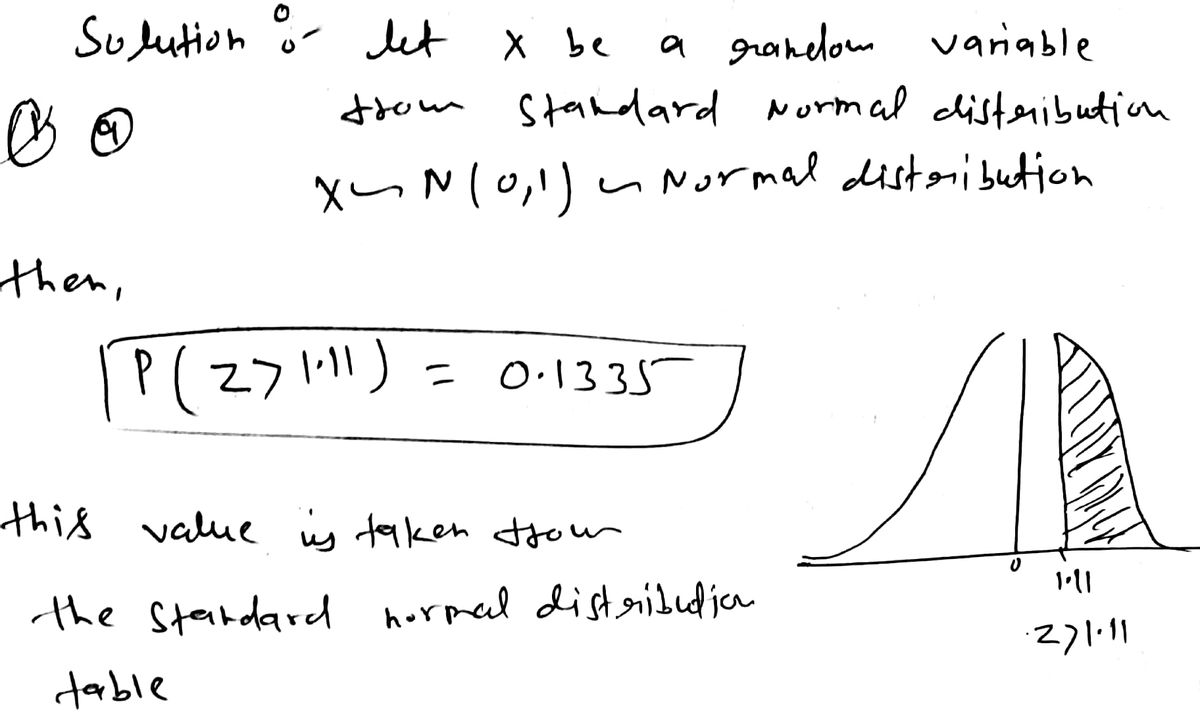
"Find the area of the shaded region under the standard normal curve."
There is a link provided:
"Click here to view the standard normal table."
**Prompt:**
"The area of the shaded region is [ ] (Round to four decimal places as needed.)"
**Diagram Explanation:**
The diagram on the right displays a standard normal distribution curve with a shaded area. The curve represents a bell-shaped graph typical of a normal distribution. The shaded region is to the right of the vertical line at \( z = 1.11 \). This line indicates the \( z \)-score for which the area to the right is of interest.
At the bottom, there is a "Next" button indicating progression after inputting the solution.](/v2/_next/image?url=https%3A%2F%2Fcontent.bartleby.com%2Fqna-images%2Fquestion%2Fdabeff17-6e30-4e7b-b604-e664e91c4527%2F1eb83036-da11-419c-9c4e-9f754cdc2e78%2F88f90rj_processed.jpeg&w=3840&q=75)
Transcribed Image Text:The image shows a problem statement and a diagram, which are part of an educational activity for finding the area under the standard normal curve.
**Problem Statement:**
"Find the area of the shaded region under the standard normal curve."
There is a link provided:
"Click here to view the standard normal table."
**Prompt:**
"The area of the shaded region is [ ] (Round to four decimal places as needed.)"
**Diagram Explanation:**
The diagram on the right displays a standard normal distribution curve with a shaded area. The curve represents a bell-shaped graph typical of a normal distribution. The shaded region is to the right of the vertical line at \( z = 1.11 \). This line indicates the \( z \)-score for which the area to the right is of interest.
At the bottom, there is a "Next" button indicating progression after inputting the solution.
![**Title: Identifying a Probability Distribution**
**Table of Distribution:**
The table below provides values of a variable \( x \) and their corresponding probabilities \( P(x) \).
\[
\begin{array}{c|cccccc}
x & 0 & 1 & 2 & 3 & 4 & 5 \\
\hline
P(x) & \frac{1}{10} & \frac{1}{10} & \frac{1}{25} & \frac{1}{50} & \frac{1}{100} & \frac{1}{20} \\
\end{array}
\]
**Question:**
Is the probability distribution a discrete distribution? Choose the correct answer below.
**Options:**
- **A.** No, because the total probability is not equal to 1.
- **B.** No, because some of the probabilities have values greater than 1 or less than 0.
- **C.** Yes, because the distribution is symmetric.
- **D.** Yes, because the probabilities sum to 1 and are all between 0 and 1, inclusive.
**Correct Answer:**
- **D.** Yes, because the probabilities sum to 1 and are all between 0 and 1, inclusive.
**Explanation:**
For a set of probabilities to define a valid probability distribution, two main conditions must be satisfied:
1. The probabilities for all potential outcomes must sum to 1.
2. Each individual probability must be between 0 and 1, inclusive.
In this case, option D correctly identifies that the given probabilities meet the criteria for a discrete probability distribution.](/v2/_next/image?url=https%3A%2F%2Fcontent.bartleby.com%2Fqna-images%2Fquestion%2Fdabeff17-6e30-4e7b-b604-e664e91c4527%2F1eb83036-da11-419c-9c4e-9f754cdc2e78%2F87j6kzd_processed.jpeg&w=3840&q=75)
Transcribed Image Text:**Title: Identifying a Probability Distribution**
**Table of Distribution:**
The table below provides values of a variable \( x \) and their corresponding probabilities \( P(x) \).
\[
\begin{array}{c|cccccc}
x & 0 & 1 & 2 & 3 & 4 & 5 \\
\hline
P(x) & \frac{1}{10} & \frac{1}{10} & \frac{1}{25} & \frac{1}{50} & \frac{1}{100} & \frac{1}{20} \\
\end{array}
\]
**Question:**
Is the probability distribution a discrete distribution? Choose the correct answer below.
**Options:**
- **A.** No, because the total probability is not equal to 1.
- **B.** No, because some of the probabilities have values greater than 1 or less than 0.
- **C.** Yes, because the distribution is symmetric.
- **D.** Yes, because the probabilities sum to 1 and are all between 0 and 1, inclusive.
**Correct Answer:**
- **D.** Yes, because the probabilities sum to 1 and are all between 0 and 1, inclusive.
**Explanation:**
For a set of probabilities to define a valid probability distribution, two main conditions must be satisfied:
1. The probabilities for all potential outcomes must sum to 1.
2. Each individual probability must be between 0 and 1, inclusive.
In this case, option D correctly identifies that the given probabilities meet the criteria for a discrete probability distribution.
Expert Solution
Step 1

Trending now
This is a popular solution!

Step by step
Solved in 3 steps with 2 images

Recommended textbooks for you
A First Course in Probability (10th Edition)
Probability
ISBN:
9780134753119
Author:
Sheldon Ross
Publisher:
PEARSON

A First Course in Probability (10th Edition)
Probability
ISBN:
9780134753119
Author:
Sheldon Ross
Publisher:
PEARSON