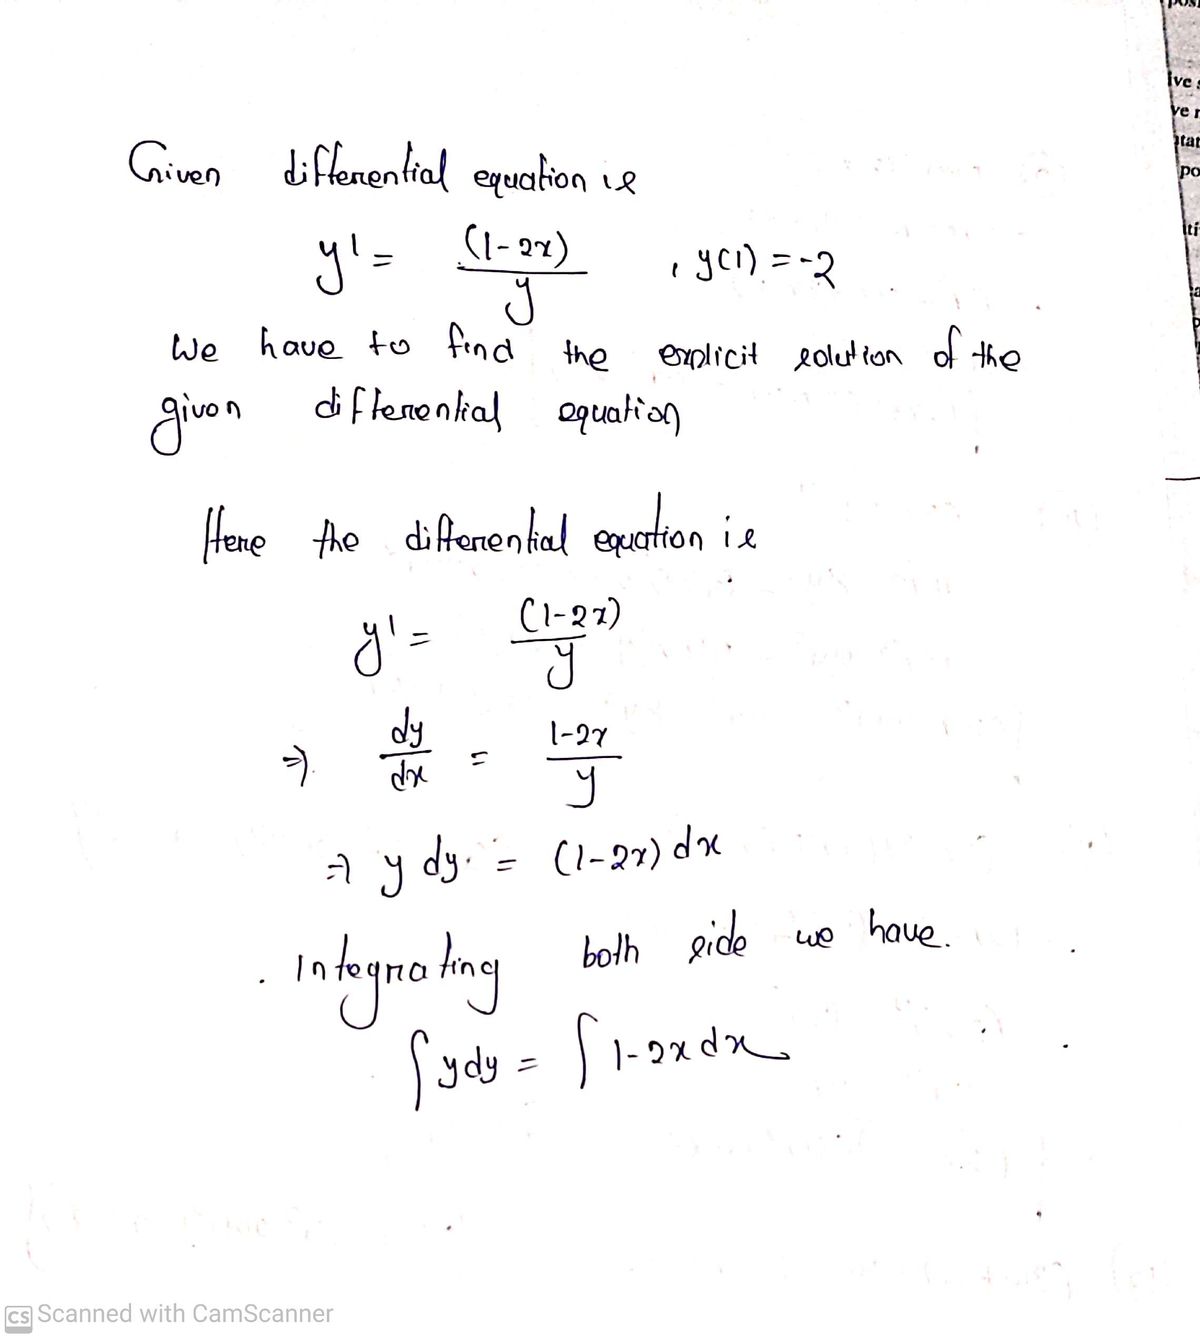
Find an explicit solution y' = - (1−2x), y(1)= −2
Q: ussessing your outp the missing parts of the table. Some vour guidance. 2 tailed or Rejection Region…
A: According to guidelines we solve first question when given questions are different.
Q: Introductory Social Statistics IMPORTANT INSTRUCTIONS: | show statistical formula used, process of…
A: The data is given on the test scores of students in a specific course. Sample size (n) = 70 To find…
Q: An engineer wants to determine the effectiveness of a safety program. He collects annual loss of…
A: Given data:
Q: Scores on a Test Class Frequency 30-37 4 38-45 14 46-53 14 54 61 62-69 10 Step 3 of 5: Determine the…
A: We have given that the grouped data with the frequency in tabulated form.
Q: The statistics process step which deals with graphing and numerically summarizing data is Group of…
A: Introduction: A statistical analysis is performed in various steps.
Q: I attatched a picture of what I am referring to... I was able to do the math part for this…
A: In this context, the aim is to test whether the car preference and purchase are independent.…
Q: Heights The boxplot shown below results from the heights (cm) of males listed in Data Set 1 “Body…
A: The box plot contains 5-number summary. That is, the minimum value, the first quartile, the second…
Q: One of the keys to successfully visualizing your data is matching your data types to the Pie charts…
A: Given.... On of the key to successfully visualising your data is matching your data type is ......
Q: Question 6 of 8 Which values are solutions to the inequality below? Check all that apply. < 10
A:
Q: The data was obtained in a study on the number of absences in the day and the final grades of seven…
A: Given data: Student Number of Absences Final Grade A 6 82 B 2 86 C 15 43 D 9 74 E 12 58…
Q: population mean = 7 is an example of what hypothesis? Group of answer choices
A: Given Population mean = 7
Q: Below displays the sample sizes and percentages of people in different age and gender groups who…
A: Introduction: It is required to identify the correct option.
Q: Researcher’s identity their sample of the study as part of the research methodology but need to…
A: The researcher needs to make sure that the correct respondents answer the questionnaires and for…
Q: One way to estimate a is to do the following. Suppose you draw a square and its inscribed circle on…
A:
Q: Let S be the surface of the solid below the ry-plane bounded by 2² = a² + y² and z² + y² + z² = 4,…
A: Given - Let S be the surface of the solid below the xy-plane bounded by z2 = x2 + y2 and x2 + y2 +…
Q: The human resources manager of a certain company is concerned about the level of employee…
A: Standardized residuals gives the strength of distance between the expected and observed values. If…
Q: . a control chart a Pareto chart . a frequency distribution hart
A: Pareto Analysis is a technique used based on the 80/20 rule and used in business decision making.…
Q: help please answer in text form with proper workings and explanation for each and every part and…
A: We will conduct a paired t-test to compare the scores of Test A and Test B. Step 1: Calculate the…
Q: A parameter is a numerical attribute of a while a statistic is a numerical attribute of a sample;…
A: Followings are the Explanation of the question Option :- Population , Sample 1) Population :- It…
Q: Inferential statistics involve an analysis of a population in order to generalize results to smaller…
A: We have given a statement: Inferential statistics involve an analysis of a population in order to…
Q: GIVEN: A researcher aims to know the impact of COVID-19 on the companies in Southwest America…
A: Here we are given a paragraph. We have to answer some questions regarding the research.
Q: Number Gender Exam 1 Exam 2 Exam 3 Homework Lab Number grade Letter grade Z-score Absolute z-score…
A: As per our guidelines, we are allowed to answer first three sub-parts only. Thanks Given :…
Q: hello I'm looking for my answer This project is to help you apply concepts to real world, real data…
A: Given information: Age Class Math 22 Junior 28 21 Senior 23 22 Senior 25 21 Sophomore 19…
Q: Organizing a set of scores in a table is an example of using parameters statistics O inferential…
A: descriptive statistics is abridged and organized characteristics of data set.
Q: Number Gender Exam 1 Exam 2 Exam 3 Homework Lab Number grade Letter grade Z-score Absolute z-score…
A: The kth percentile means that k% of the values are less than or equal to that value.
Q: College Students and Paying Jobs Exercise 2.16 introduces data from a survey that included 5204…
A: Hey there! Thank you for posting the question. Since there are multiple questions posted, we will…
Q: ta when it is observed ?partially Medical statistics Randomly statistics
A: In statistics we obtain the data, followed by ways to summarize, analyze and infer conclusions from…
Q: Do people walk faster in the airport when they are departing (getting on a plane) or do they walk…
A: a.Experimental study: An experimental study is a study, in which the investigator themselves control…
Q: hello , my answer no graphs needed I want the answers of the writing This project is to help you…
A: Given information: Age Class Math 22 Junior 28 21 Senior 23 22 Senior 25 21 Sophomore 19…
Q: Exercise - An electrical engineer has on hand two boxes of resistors, with four resistors in each…
A: Hi! Thank you for the question, As per the honor code, we are allowed to answer three sub-parts at a…
Q: Number Gender Exam 1 Exam 2 Exam 3 Homework Lab Number grade Letter grade Z-score Absolute z-score…
A: As per our guidelines,we are allowed to answer first three sub-parts only. Thanks 1) Interval and…
Q: Formula to calculate the median in excel Select one: O a. =median(e4;e6) O b. All the options are…
A: Median: For a set of n observations, median is defined as the middle most value. To find median, we…
Q: (a) Find P(male linternal medicine). Round your answer to three decimal places. P(malelinternal…
A: we have given a table from the table we have to find the probabilities asked in different subparts…
Q: The first test a doctor would order to determine whether a person is infected with HIV (the virus…
A: Note: As per our Honor code policy, we are authorized to answer only three sub parts at a time. So,…
Q: Question content area top Part 1 The accompanying data set lists diastolic blood pressure…
A: First, we need to sort the data in ascending order. The sorted data set is: 60, 64, 64, 66, 66, 68,…
Q: (a) r=-0.787 (b) r=-0.025 (c) r= -1 (d) r= -0.992 Click the icon to view the scatter diagrams. r=…
A: The scatter plot is used to determine the association between two numerical variables. It shows…
Q: You are trying to find out if membership in an extracurricular club is dependent upon whether you…
A:
Q: definition of population
A: In this case, we need to define population.
Q: Dataset 1: 3, 5, 6, 7, 9 The IQR of dataset 1 from ___ to ___. I understand that IQR= Q3-Q1, I'm…
A: The following data set has been provided:It is required to find the interquartile range.
Q: 9. Craig is traveling east-west along a straight path. Craig's velocity can be modeled by v(t) = -5t…
A: As you asked multiple subpart question so according to the rule I answered only first three subpart…
Q: Define the following concepts and where possible, give examples: (a) Formative assessment (b)…
A: We have to define Formative assessment Evaluation & Descriptive stastics
Q: help please answer in text form with proper workings and explanation for each and every part and…
A: To test the claim that the three categories of cigarettes yield the same median amount of nicotine,…
Discrete Math
show work and box final answer
Step by step
Solved in 2 steps with 2 images
- Test is the process of assigning a value (a number or quality) to the characteristic being measured. True FalseWhat do you understand by independence of attributes ? Give a criterion of independence for attributes A and B. CS Scanned with CamScannerNumber Gender Exam 1 Exam 2 Exam 3 Homework Lab Number grade Letter grade Z-score Absolute z-score 1 0 61 94 76 94 87 82.4 B 0.18 0.18 2 0 99 97 90 100 89 95 A 1.38 1.38 3 0 64 76 69 88 87 76.8 C -0.36 0.36 4 0 77 82 86 98 94 87.4 B 0.66 0.66 5 0 70 89 81 93 97 86 B 0.52 0.52 6 0 67 62 65 60 90 68.8 D -1.13 1.13 7 0 87 83 81 85 68 80.8 B 0.02 0.02 8 0 74 88 65 49 90 73.2 C -0.71 0.71 9 0 91 97 87 81 94 90 A 0.90 0.90 10 0 94 87 77 90 67 83 B 0.23 0.23 11 0 47 72 54 59 63 59 F -2.07 2.07 12 0 81 64 78 84 73 76 C -0.44 0.44 13 0 87 90 81 93 80 86.2 B 0.54 0.54 14 0 96 100 84 97 84 92.2 A 1.12 1.12 15 0 80 76 90 85 85 83.2 B 0.25 0.25 16 0 64 51 69 74 78 67.2 D -1.28 1.28 17 0 70 86 84 77 75 78.4 C -0.21 0.21 18 0 80 93 98 95 98 92.8 A 1.17 1.17 19 0 88 83 83 90 84 85.6 B 0.48 0.48 20 0 52 46 62 70 59 57.8 F -2.19 2.19 21 0 97 83 83 85 98 89.2 B 0.83 0.83 22 1 80 74 90 83 65 78.4 C -0.21 0.21 23 1 86 81 72 85 97 84.2 B 0.35 0.35 24 1 88 99…
- Doctor Specialties Below are listed the numbers of doctors in various specialties by gender. Psychiatry Pathology Gynecology Male 27,319 12,551 23,813 Female 14,066 6620 18,520 Send data to Excel Choose 1 doctor at random. Part: 0 / 4 Part 1 of 4 (a) Find P (female psychiatry). Round your answer to three decimal places. P (female|psychiatry) = |Using ExelSubject: STATISTICS
- XRO4-05 The number of items rejected daily by a manufacturer because of defects was recorded for the past 30 days. The results are as follows. 4 9 12 15 5 7 3 10 8 13 7 5 8 8. 15 17 19 6 4 22 16 9 5 3 19 14 13 18 7 a Construct a histogram. b Construct an ogive. c Describe the shape of the histogram.The data for recent year showed the taxes and million dollars received from a random sample 10 states find the first and third quarters in the IQ are 31 5 20 36 33 13 11 26 30 28Systematically acquired information that is organized following the procedures of science and statistics is (are) called
- Safari File Edit View History Bookmarks Window Help Wed 7:54 A myopenmath.com + MyOpenMath b My Questions | bartleby What is the mean of the data set comprising the numbers 7, 8, 2, 5 and 8? Submit Question 00Introductory Statistics 3rd edition - 8.34 p-values For each graph, state whether the shaded area could represent a p-value. Explain why or why not. If yes, state whether the area could represent the p-value for a one-sided or a two-sided alternative hypothesis. (images are the graphs)Statistics students at a state college compiled the following two-way table from a sample of randomly selected students at their college: Play chess Don’t play chess Male students 25 162 Female students 19 148 Answer the following questions about the table. Be sure to show any calculations. What question about the population of students at the state college would this table attempt to answer?State Hº and Hª for the test related to this table.