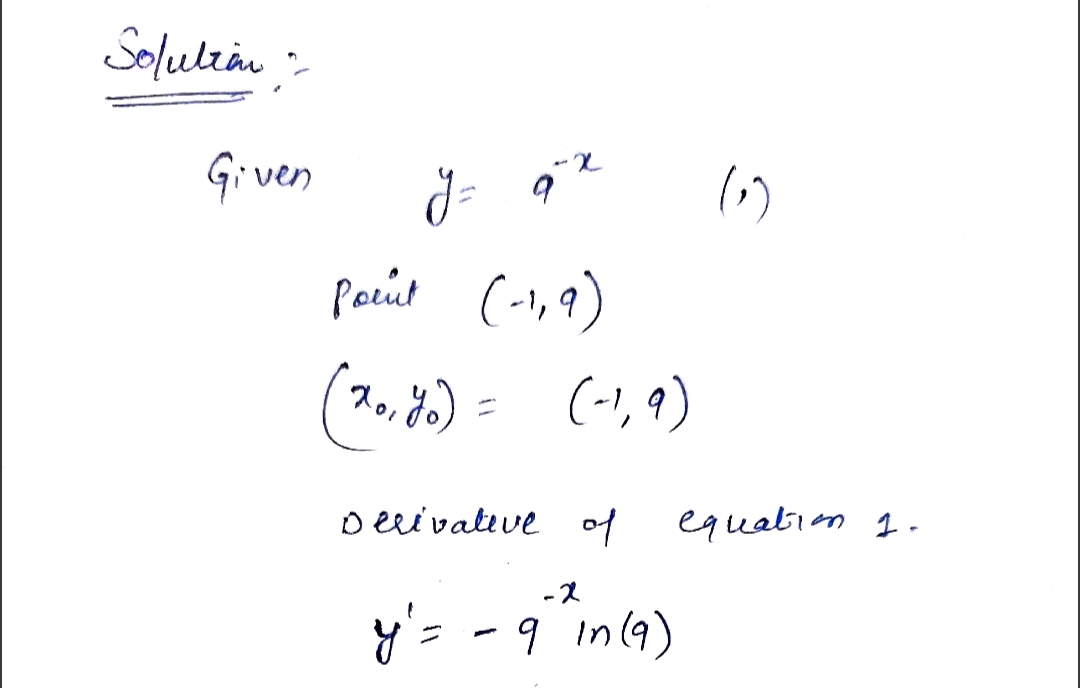
Find an equation of the tangent line to the graph of y=9* at the point (-1,9). 01) y=9_(x+1) 9 9 ○ 2) y = 9(1-1n(9)(x+1)) ○ 3) y = 9(1-1n(9)(x-1)) ○ 4) y = 9(1+1n(9)(x+1)) 5) None of the above.
Q: I don't understand how to solve part (b). For my answer I used the number of females with degrees…
A: Given Data
Q: If z = 1.75, SD = 3.03, and M = 19.75, what is X?
A: given data Z = 1.75 s = 3.03 M = 19.75 x = ?
Q: For this problem, carry at least four digits after the decimal in your calculations. Answers may…
A: Given : A random sample of 5454 physicians in Colorado showed that 3359 provided at least some…
Q: Assuming the requirements are met for the penny study, what is the lower bound for a 99% confidence…
A: Given that, The sample proportion of 1 and 2 are,
Q: I lost my notes for solving this sample question for an upcoming exam. Some help reviewing would be…
A: Binomial distribution:The binomial distribution gives the probability of number of successes out of…
Q: Assuming the requirements are met for the penny study, what is the margin of error for a 95%…
A: given data n1 = 116 x1 = 80p^1 = x1n1 = 80116 = 0.6897 n2 = 137 x2 = 91 p^2 = x2n2 = 91137 =…
Q: The two major tests used to assess readiness for college are SAT and ACT. ACT scores N(21.5, 3.2)…
A: Z - score : It is also called as standard normal variate . Z score follows normal distribution with…
Q: Rob and Maria were comparing test scores in their math class. Rob had three tests of 82, 85 and 73.…
A: Given, scores of Rob are 82,85,73. And scores of 75,79,and 86 We know, Arithmetic mean=sum of…
Q: 4. How can the slope be interpreted? 5. What is the y-intercept of the line? 6. What does the…
A: Given : The data of enrollment in past ten years, to evaluate the slope and y-intercept.
Q: Television Set Ownership According to Nielsen Media Research, of all the U.S. households that owned…
A: Identify the claim. The claim is stated below as follows: From the information, given the…
Q: Loras Tyrell was curious to see if his students actually saved money by purchasing books from…
A: From the given output : Population Mean,μ = 12.75 Population Standard Deviation,σ =…
Q: In real-life applications, statistics helps us analyze data to extract information about a…
A: Grade level No. of Classroom Total Students Males Females 9th Grade 10 200 100 100 10th Grade 12…
Q: If Julio’s score on an IQ test is 73, what is his score as a z score? (M = 100, s = 15)
A: The z-score is obtained below: From the given information, the Julio’s score on an IQ test is 73.…
Q: For this problem, carry at least four digits after the decimal in your calculations. Answers may…
A: Given: Sample size n = 833 Number of fish died X = 22 Formula Used: Sample proportion p = Xn Formula…
Q: Sarah was calculating the speeds (mph) of vehicles travelling down Maple Street on two separate days…
A:
Q: s of (b) and (c) are the same, which drug appears to be better? If not, explain how the discrepancy…
A: Given: Woman Cure Rate Men Cure Rate Drug A 5 of 100 cured 5% 400 of 800 cured 50% Drug B…
Q: Does octane matter? Some people believe that higher octane fuels result in better gas mileage for…
A: Given that, Some people believe that higher octane fuels result in better gas mileage for their…
Q: Ms. Eisenman wanted to know her average student’s score on the most recent chapter test and what…
A: Ms. Eisenman wanted to know her average student’s score on the most recent chapter test and what…
Q: Write missing values in the statements a. and b. a. If Anna has scored 510 on the MCAT, and was at…
A: Anna scored 510 on the MCAT which is at the 80th percentile.Maria scored 520 on the MCAT which is at…
Q: A poll done for Newsweek found that 15% of Americans have seen or sensed the presence of an angel. A…
A: In statistic, Individual means, a thing on which the characteristics is studied. The total…
Q: A Data Analytics student wishes to forget about this test and goes to the nearest bar. The student…
A: In this problem, we will use linear programming to help a Data Analytics student determine the…
Q: C. The test statistic (t |(please show your answer to 3 decimal places.) d. The p-value = (Please…
A:
Q: My kid wants to know if sledding down the hill is more fun as you have more people piled on the sled…
A: Statistical test are used to obtain some conclusion about the population by taking sample from the…
Q: what was the equation though?
A: Note: The previous solution is incorrectly solved. The end behaviors of the function are incorrectly…
Q: A researcher is examining whether daily exercise influences mood. The researcher assigns n = 27…
A: The sample size for first sample is 27, the sample mean is 23 and sum of square is 182. The sample…
Q: John was feeling depressed and anxious. His therapist gave him a depression test (M = 10, s = 3),…
A: Given information: Let, X1 be the therapist gave depression test, So score of test by giving…
Q: Please answer the following and show how to solve using the graphing calculator. Thank you
A: To solve this problem using a graphing calculator (such as the TI-84 Plus), follow these steps:Step…
Q: Many graduate school programs in the United States require applicants to take the Graduate Record…
A: (a) We have to fill the following table - Intended Major Below 700 700 to 800 Total Economics…
Q: The principal of Paul Revere High School bragged that his 2016 graduating class of 1500 students…
A: Given:Number of categories = 3Level of significance (α) = 0.05.
Q: To get a grade of C + , a student must have a mean average of 77 or greater. Jim has a mean average…
A: Jim has mean average of 76 for 10 quizzes. i.e. Jim has scored total of 76×10=760, combining all 10…
Q: Suppose the score of 58.9 in the traditional course was incorrectly recorded as 589. How does this…
A: The range in statistics is the difference between the highest and the lowest values in a data set.…
Q: A survey was given to 344 people asking whether people like dogs and/or cats. 167 said they like…
A: Let n(A): donates the number of people like event A. given n(dogs)=167 n(cats)=170 n(don't likes…
Q: Assuming the requirements are met for the penny study, what is the upper bound for a 90% confidence…
A: given data n1 =116 x1 =80p^1 = x1n1 = 80116 =0.6897 n2 = 137 x2 = 91 p^2 = x2n2 = 91137 =…
Q: The table below shows the marks out of 40 for nine students on two tests. The tests cover similar…
A: The question is about correlation and regression Given : To find : a ) Pearson correlation…
Q: If we have a score of 100 and is 20% of the grade and a score of 89 which is 40%. What is my grade?
A: According to the given information, weights are assigned to each of the two scores and the sum of…
Q: I need help with just part c. Someone on here already answered it for me but I'm really confused as…
A: Central Limit Theorem for Proportion:Let p be the population proportion, n be the sample size and…
Q: Answer both of the following questions. 1. Think of two things that you can measure. Give one that…
A:
Q: Many graduate school programs in the United States require applicants to take the Graduate Record…
A: Given, Intended major Below 700 700 to 800 Total Economics 2143 6775 Political science…
Q: Practice using the Age Data Given: X= 45.5, s= 4.81, N= 50 1. Find the z-score value associated with…
A: Note- I am answering the only 1st question which you have asked. Given information- Sample mean,…
I am also not sure about this one, because the answer I get isn't listed, but I don't know if my math is just wrong.
Step by step
Solved in 2 steps with 2 images
- Many graduate school programs in the United States require applicants to take the Graduate Record Exam, also called the GRE. One part of the exam, the GRE-Quantitative test, assesses students' level of quantitative reasoning and thinking - exactly the skills we are building in our class this semester. The highest score possible on the GRE-Quantitative test is a score of 800. Many graduate schools think that a score of 700 or higher on the GRE-Quantitative test shows that the applicant has strong quantitative skills. The table shows the number of people who took the GRE between 2003 and 2006 who had GRE-Quantitative test scores of 700 or higher. All of the people represented in the table planned to major in one of the two listed areas of the social sciences. a. Complete the table. 1 N D AS GRE-QUANTITATIVE SCOREneed answer and all the workSamantha took an exam in her statistics class and received 90 out of 100. Samantha thought that was a good score, but she wanted to know how high her score was in relation to the rest of the class. Her professor said her Z-score was -0.29. How should Samantha interpret her Z-score? a. Samantha’s score is 0.29 points above the class mean.b. Samantha’s score is 29% above than the class mean.c. Samantha’s score is 0.29 standard deviations above the class mean.d. Samantha’s score is 0.29 standard deviations below the class mean.
- You believed that sending positive thoughts to your classmates that have been so much bothered with virtual classes will change their performance. You got their prelim grades before you send them bunch of thoughtful messages then got their midterm grades. Did your positive messages somehow made difference in their performance?Roads A, B, and C are the only way to escape from a certain provincial prison. Prison records show that, of the prisoners who tried to escape, 17% used road A, 13 % used road B, the remainder used road C. The records also indicate that 72 % of those who tried to escape using road A were captured. 62 % of those using road B were captured, and 21% of those using road C were captured. Use four decimals in your answers. (a) What is the probability that a prisoner escaping from this provincial prison is not captured? 0.65 (b) What is the probability that a captured prisoner used road A in their escape attempt? (c) What is the probability that a prisoner who didn't get captured has used road C?The following data was collected to explore how the number of square feet in a house, the number of bedrooms, and the age of the house affect the selling price of the house. The dependent variable is the selling price of the house, the first independent variable (x1�1) is the square footage, the second independent variable (x2�2) is the number of bedrooms, and the third independent variable (x3�3) is the age of the house. Effects on Selling Price of Houses Square Feet Number of Bedrooms Age Selling Price 11191119 33 33 100900100900 13081308 33 44 119800119800 14521452 33 66 189800189800 16931693 33 66 190500190500 20052005 33 66 196900196900 22102210 33 99 216600216600 23012301 44 99 250900250900 23452345 44 1010 267800267800 28532853 55 1313 270000270000 Copy Data Step 1 of 2 : Find the p-value for the regression equation that fits the given data. Round your answer to four decimal places
- Please all solve the questionTanya takes her physics test and is told that her z-score is 3.10. What percentage of students scored below Tanya? The answer is 99.10% I would like to see the work for this problem please.The past records of a supermarket show that its customers spend an average of $110 per visit at this store. Recently the management of the store initiated a promotional campaign according to which each customer receives points based on the total money spent at the store, and these points can be used to buy products at the store. The management expects that as a result of this campaign, the customers should be encouraged to spend more money at the store. To check whether this is true, the manager of the store took a sample of 14 customers who visited the store. The following data give the money (in dollars) spent by these customers at this supermarket during their visits. 106.13 107.43 124.68 124.88 101.17 72.75 85.45 86.05 100.4 98.84 101.63 95.56 89.40 119.52 Assume that the money spent by all customers at this supermarket has a normal distribution. Using a 2.5% significance level, can you conclude that the mean amount of money spent by all customers at this supermarket after the…
- PLEASE HELP SOLVE THE PROBLEM BELOW A candy manufacturer selects mints at random from the production line and weighs them. For one week, the day shift weighed n1 = 194 mints and the night shift weighed n2 = 162 mints. The numbers of these mints that weighed at most 21 grams was y1 = 28 for the day shift and y2 = 11 for the night shift. Let p1 and p2 denote the proportions of mints that weigh at most 21 grams for the day and night shifts, respectively. Give a point estimate of p1 Give the 95% confidence interval for p1 Give a point estimate of p1 − p2 Find the 95% confidence interval for p1 − p2When rolling a number cube, labeled 1 through 6,P(4) is twice as likely to occur as P (2).