FBD TOP ВOTTOM Figure 7-12
Related questions
Question
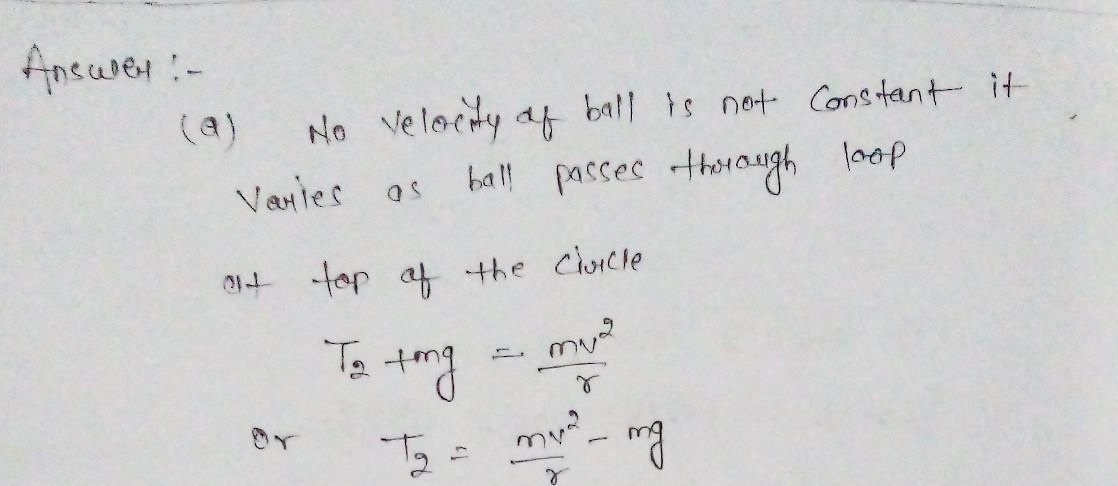
Observe the motion of a ball that rolls down a track and then executes a loop-the-loop, provided it has sufficient velocity.
a. is the velocity of the ball constant as it moves theough the loop? Where is the ball when its velocity is a maximum and when it is a minimum?
b. Based on the answer to a, when is the centripetal acceleration maximum and minimum? Can it ever be less than 9.8 meters per second?

Transcribed Image Text:**Transcription with Diagram Explanation for Educational Website**
---
**Figure 7-12**
**Diagram Description:**
The diagram illustrates the path of a ball on a curved track, depicting motion in different sections: FBD (Free Body Diagram), TOP, and BOTTOM.
1. **Path of Motion:**
- The track begins with a downward slope that transitions into a loop. Arrows along the track denote the direction of the ball's motion.
2. **Sections Explained:**
- **FBD Section:** The diagram likely suggests where forces acting on the ball could be represented in a Free Body Diagram, though the actual forces are not shown.
- **TOP Section:** Exemplar position at the highest point of the loop. The ball is depicted here, possibly indicating that this is a critical point with maximum potential energy and minimal kinetic energy.
- **BOTTOM Section:** The ball is shown at the lowest part of the loop, implying maximum kinetic energy following conversion from potential energy.
3. **Arrows along the Path:**
- Arrows indicate changes in direction as the ball moves through the curved path and loop, highlighting transitional dynamics.
This diagram effectively visualizes concepts of energy transformation and motion dynamics, making it useful for understanding principles of physics such as kinetic and potential energy, centripetal force, and motion on curved paths.
---
Expert Solution
Step 1

Step by step
Solved in 2 steps with 2 images
