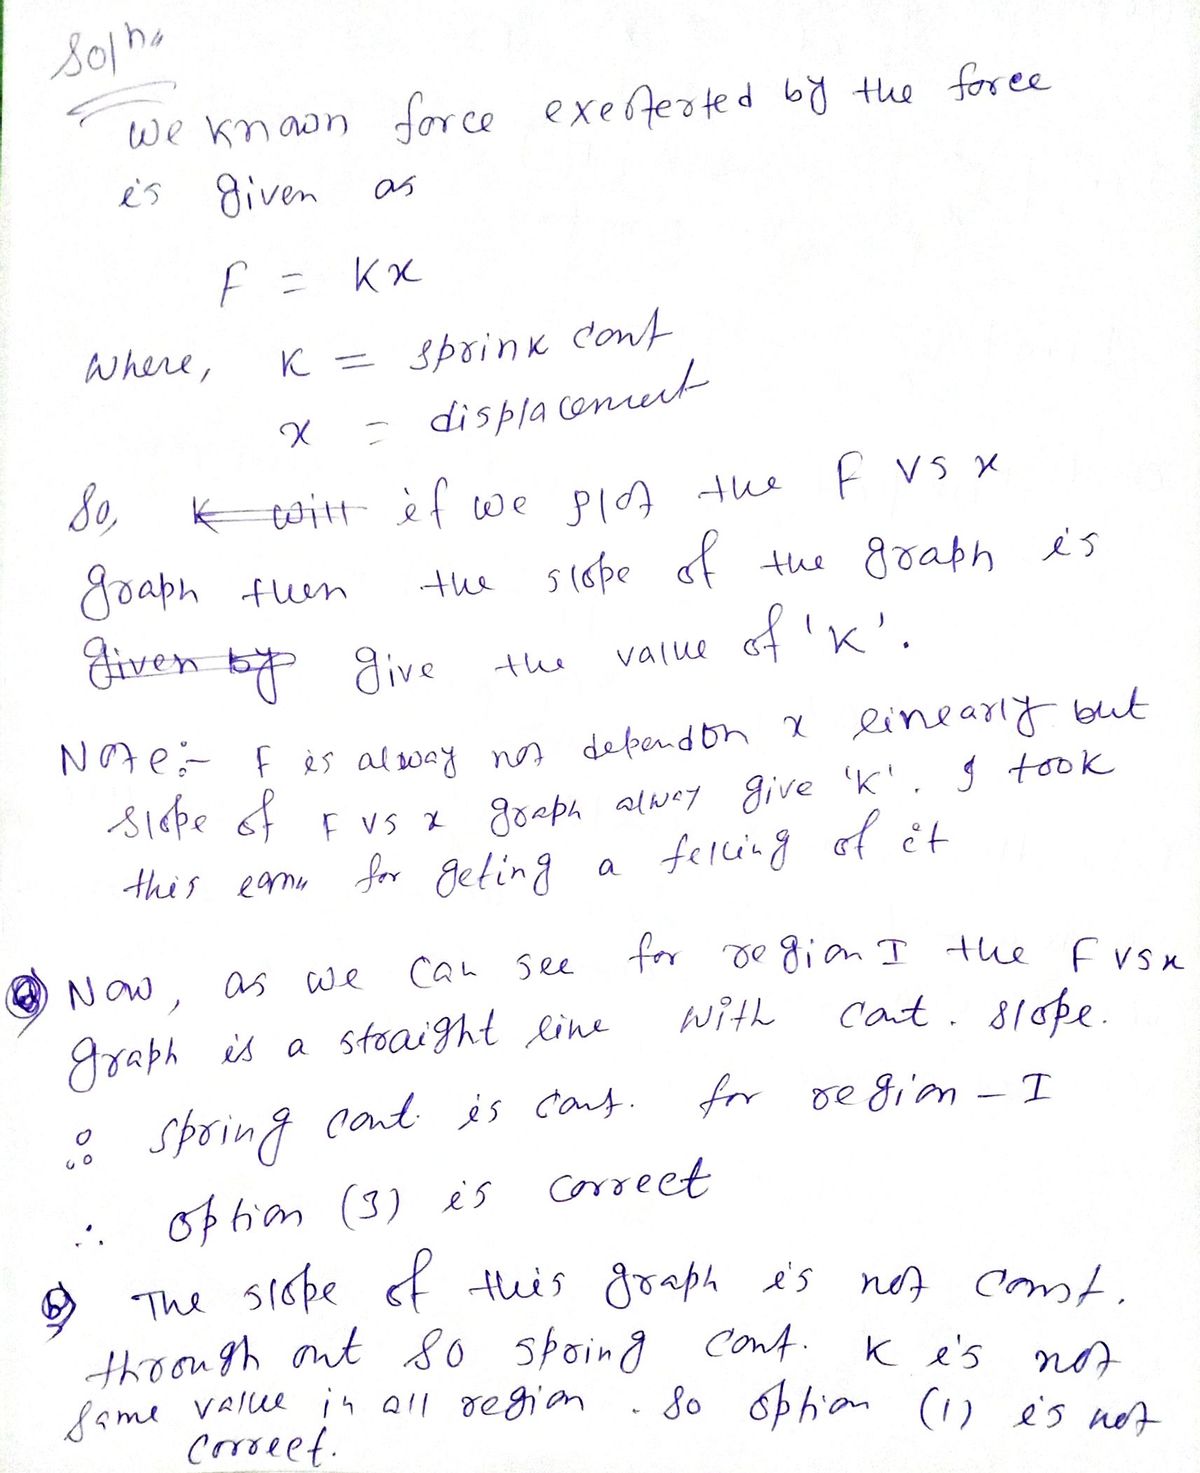
Extension I3D II The spring constant k is the same value in all regions. The spring is "stiffer" when it is stretched to the lengths of region III than it is for the lengths of region I. The spring constant k is constant in region I. The force exerted by the spring will depend on the mass attached to the spring.
Extension I3D II The spring constant k is the same value in all regions. The spring is "stiffer" when it is stretched to the lengths of region III than it is for the lengths of region I. The spring constant k is constant in region I. The force exerted by the spring will depend on the mass attached to the spring.
Related questions
Question
![### Graph Explanation:
The image displays a graph with a curve that plots the relationship between force and extension for a spring. The x-axis represents "Extension," and the graph is divided into three regions labeled I, II, and III:
- **Region I**: The initial part of the graph shows a relatively linear increase in force with extension.
- **Region II**: The graph begins to curve slightly, indicating a deviation from the linear relationship.
- **Region III**: The curve becomes steeper, showing a larger increase in force for a given extension compared to Regions I and II.
### Prompts with Checkboxes:
- [ ] The spring constant \( k \) is the same value in all regions.
- [ ] The spring is “stiffer” when it is stretched to the lengths of region III than it is for the lengths of region I.
- [ ] The spring constant \( k \) is constant in region I.
- [ ] The force exerted by the spring will depend on the mass attached to the spring.](/v2/_next/image?url=https%3A%2F%2Fcontent.bartleby.com%2Fqna-images%2Fquestion%2Fdac48a7c-98c2-4f78-84b8-98cce02408b4%2F5995ce07-81cf-4a0f-844a-f847d39ff6ce%2Fmfokkzt_processed.jpeg&w=3840&q=75)
Transcribed Image Text:### Graph Explanation:
The image displays a graph with a curve that plots the relationship between force and extension for a spring. The x-axis represents "Extension," and the graph is divided into three regions labeled I, II, and III:
- **Region I**: The initial part of the graph shows a relatively linear increase in force with extension.
- **Region II**: The graph begins to curve slightly, indicating a deviation from the linear relationship.
- **Region III**: The curve becomes steeper, showing a larger increase in force for a given extension compared to Regions I and II.
### Prompts with Checkboxes:
- [ ] The spring constant \( k \) is the same value in all regions.
- [ ] The spring is “stiffer” when it is stretched to the lengths of region III than it is for the lengths of region I.
- [ ] The spring constant \( k \) is constant in region I.
- [ ] The force exerted by the spring will depend on the mass attached to the spring.

Transcribed Image Text:Below is a graph of force exerted by a spring based on the extension of the spring beyond its equilibrium length. Referring to this graph, choose all the correct statements below.
**Graph Explanation:**
The graph shows the relationship between the force exerted by a spring and its extension. The x-axis represents the extension of the spring, while the y-axis represents the force. The graph is divided into three sections labeled I, II, and III.
- **Section I:** The relationship between force and extension is linear, indicating that the spring follows Hooke's Law in this region, where force is directly proportional to extension.
- **Section II:** The graph begins to curve upwards, suggesting a nonlinear relationship, indicating the spring is starting to stretch beyond its proportional limit.
- **Section III:** The curve becomes steeper, which indicates that the spring has surpassed its elastic limit and is experiencing deformation where the force increases rapidly with little extension.
This information helps in understanding how springs behave under different levels of force and extension.
Expert Solution
Step 1

Step by step
Solved in 2 steps with 2 images
