Each year University Park estimates the standard deviation of the time it takes for the bus to travel from the Beaver Center to Downtown. To develop an estimate for the standard deviation, the city has collected a random sample of the times required for 13 trips. Last year, the sample standard deviation was 4.5 minutes. The sample standard deviation for the current semester is 5.5 minutes. Overall, the buses were 5.45 minutes late on average. The interest is to see if this year the variability in time has increased (possibly due to a reduction in the number of students who brought cars). Please calculate the test statistic and pvalue. What can be concluded? Support your answer.
Inverse Normal Distribution
The method used for finding the corresponding z-critical value in a normal distribution using the known probability is said to be an inverse normal distribution. The inverse normal distribution is a continuous probability distribution with a family of two parameters.
Mean, Median, Mode
It is a descriptive summary of a data set. It can be defined by using some of the measures. The central tendencies do not provide information regarding individual data from the dataset. However, they give a summary of the data set. The central tendency or measure of central tendency is a central or typical value for a probability distribution.
Z-Scores
A z-score is a unit of measurement used in statistics to describe the position of a raw score in terms of its distance from the mean, measured with reference to standard deviation from the mean. Z-scores are useful in statistics because they allow comparison between two scores that belong to different normal distributions.
Each year University Park estimates the standard deviation of the time it takes for the bus to travel from the Beaver Center to Downtown. To develop an estimate for the standard deviation, the city has collected a random sample of the times required for 13 trips. Last year, the sample standard deviation was 4.5 minutes. The sample standard deviation for the current semester is 5.5 minutes. Overall, the buses were 5.45 minutes late on average. The interest is to see if this year the variability in time has increased (possibly due to a reduction in the number of students who brought cars).
- Please calculate the test statistic and pvalue.
- What can be concluded? Support your answer.
The investigator is specially interested to test whether the variability in time has increased in the current year than the previous year.
Denote the population standard deviation of times required for 13 trips in the current year as σ 1.
Denote the population standard deviation of times required for 13 trips in the previous year as σ 2.
The null and alternate hypotheses are stated below:
Null hypothesis H0:
H0: σ 1 = σ 2
That is, there is no significant difference between the variability in time for the previous year and current year.
H1: σ 1 > σ 2
That is, the variability in time for the current year is greater than the variability in time for the previous year.
The sample standard deviation of times required for 13 trips in the current year is s1 = 5.5.
The sample standard deviation of times required for 13 trips in the previous year is s2 = 4.5.
Test statistic:
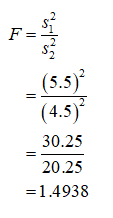
The test statistic is obtained as 1.4938 from the calculations given below:

The test statistic is F = 1.4938.
P-value:
The step by step procedure to obtain the P-value is given below:
Step 1: Open an EXCEL sheet.
Step 2: In any cell type the formula “=F.DIST.RT(1.4938,12,12)”.
Step 3: Click on Enter.
The P-value is obtained as 0.2487.
Output:

Step by step
Solved in 3 steps with 2 images


