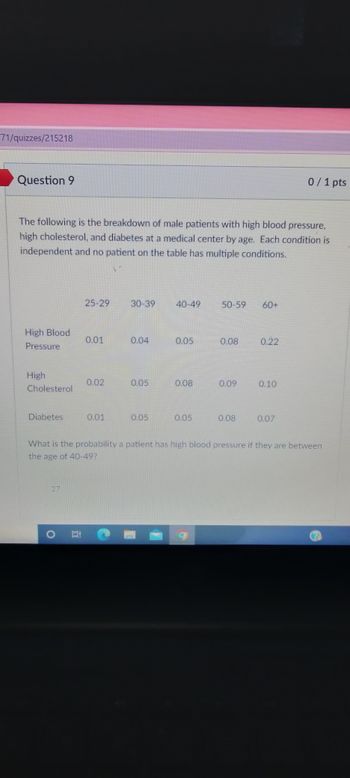
e following is the breakdown of male patients with high pod pressure, high cholesterol, and diabetes at a medical hter by age. Each condition is independent and no patien e table has multiple conditions. 25-29 30-39 40-49 50-59 60+ gh Blood 0.01 0.04 0.05 0.08 0.22 essure gh 0.02 0.05 0.08 0.09 0.10 holesterol nbotos
Q: Respondent Number Socio Economic Score in Mental Status(SES) (X) Ability 7.8 135 2 6.4 122 3 5.3 93…
A: From the above data X-Scocio Economic status (SES) Y- Score in Metal Ability Sum of XY=10396.7…
Q: The following histogram models the life-span of 100,000 randomly se- lected males using today's life…
A: A histogram is a graph that represents the frequency distribution of the data. It helps in…
Q: Are you an impulse shopper? A survey of 1000 grocery shoppers indicated that 24% of males and 57%…
A: Given : Male proportion = 0.24 Female proportion = 0.57 Sample size of male = 500 Sample size of…
Q: An engineer suspects that a power plant in the city is increasing the air pollution in the vicinity…
A: The sample observations are: Group-1 Group-2 40 34 16 28 44 36 47 19 26 35 64 37 35…
Q: 105, 90, 91, 96, 96, 91, I00, 10: a. Does this data suggest that the population mean reading for the…
A:
Q: The accompanying data represent the number of days absent, x, and the final exam score, y, for a…
A: Solution: Let X be the number of days absent and Y be the final exam score. From the given…
Q: The accompanying data represent the number of days absent, x, and the final exam score, y, for a…
A: Solution: Let X be the number of days absent and Y be the final exam score. From the given…
Q: Latasha samples 5 gyms and counts how many machines each gym has. One gym has 30 machines, one gym…
A: The data provided, which includes the counts of machines in each gym (30, 13, 30, 38, 10)We have to…
Q: pose that 80% of 3–4-year-old ch year-old children in a village are v ine. Also assume that children…
A: Age QIV group Control Group 3-4 3.78% 5.69% 5-8 1.70% 5.15% 80% of 3-4-year-old children in…
Q: A blood glucose lowering drug given to 4 subjects with Ho: Has 0 and at a = 0.05. The following data…
A:
Q: B. Refer to the following data from a Cohort study: With Lung Cancer 500 900 1,400 Smoker Non-smoker…
A: As per the guidlines we are allowed to solve only one question please put the other question…
Q: Positive autocorrelation in control charts has which of the following characteristics? OA. Is a rare…
A: Autocorrelation is used for identifying patterns in time series.
Q: Calcium is essential to tree growth because it promotes the formation of wood and maintains cell…
A: given that,sample data: (0.068 , 0.083 , 0.069 , 0.258 , 0.111 , 0.174 , 0.108 , 0.225 , 0.325 ,…
Q: The recommended daily dietary allowance for zinc among males older than age 50 years is 15 mg/day.…
A: Givensample size(n)=119Mean(x)=12.9standard deviation(s)=6.61α=0.05
Q: Blood cocaine concentration (mg/L) was determined both for a sample of individuals who had died from…
A: The following data of Blood cocaine concentration is given as:ED0, 0, 0, 0, 0.1, 0.1, 0.1, 0.1, 0.2,…
Q: The toco toucan, the largest member of the toucan family, possesses the largest beak relative to…
A: The regression analysis is conducted here by using EXCEL. The software procedure is given…
Q: Which of the following statement O None of the explanatory variables O All explanatory variables…
A: All explanatory variables predict contract value.
Q: Following
A:
Q: The following table gives the number of parking tickets obtained in a semester and the GPAs of 77…
A: The given table contains the number of parking tickets obtained in a semester and the GPAs of 7…
Q: Risk of Stroke (%) Age Pressure Smoker (Yes=1) 12 57 152 0 24 67 163 0 13 58 155 0 56 86 177 1 28 59…
A: The independent variables are Age, Pressure and Smoker. The dependent variable is Risk stroke. This…
Q: onsider the following information regarding the dividends paid per share by companies in the…
A: Solution: Given information: k= 3 groups Each group has 7 observation n1=n2=n3=7n=n1+n2+n3n=7+7+7n…
Q: Student First exam grade X Second 1 38 23 2 68 exam grade Y D=Y-X -15 NOTE: EX2=30775, 28 -40 3 . 40…
A: Given the data asStudentFirst exam grade XSecond exam grade…
Q: Risk of Stroke (%) Age Pressure Smoker (Yes=1) 12 57 152 0 24 67 163 0 13 58 155 0 56 86 177 1 28 59…
A: 1. Null Hypothesis: H0: Smoker is not a significant factor in explaining the risk of a stroke.…
Q: 1. Carbon monoxide: A recent study examined the effects of carbon monoxide exposure on a group of…
A: Given that We have to conduct hypothesis testing for the claim that to find the…
Q: Researchers were interested in finding out if triglyceride (TG) mea migher in diabetic patients (pop…
A: Given, Population 1: sample size (n1) = 15 sample mean (x̄1) = 162.5 population standard deviation…
Q: Researchers claim that the surface temperature of the world's oceans mainly changes with changing…
A: The null hypothesis for the two-way ANOVA is that there is no significant difference between the…
Q: Based on the distribution of body mass index (BMI) with µ-30. If the area below 33 is 0.84, % of…
A: Given: Mean μ=30 The area below x=33 is 0.84. Required: To find the percentage of subjects having…
Q: A scientist would like to study the effects of different light sources and time on the growth of a…
A: 1import pandas as pd 2import numpy as np 3import scipy.stats as stats 4 5# Data provided in the…
Q: Manova test A therapist interested in helping individuals with Ophidiophobia. In order to do this…
A: MANOVA
Q: The accompanying data represent the number of days absent, x, and the final exam score, y, for a…
A: Procedure to conduct regression analysis using Excel: Enter the data of x and y in an excel sheet.…
Q: # Of ID IQ Serum Cholesterol 1 118 193 105 210 3 115 196 4 108 208 106 188 6. 111 206 • IQ - are…
A: Given the IQs and Serum Cholesterols of the respondents, we need ro calculate the maximum, the…
Q: 1) in a regression analysis involving 18 observations and four independent variables, the following…
A: Sample size Multiple R = 0.6000R Square = 0.3600Standard error = 4.80000NOTE: Hi there! Thanks for…
Q: The histogram below displays the distribution of 50 ages at death due to trauma (accidents and…
A: from given histogram we make table age frequency 5-15 3 15-25 18 25-35 13 35-45 6 45-55…
Q: 2. A hypothetical study of seven people followed over seven years. Data presented in a graph as…
A: The objective is to define the point prevalence rate during year 2 and to obtain the incidence…
Q: Researchers claim that the surface temperature of the world's oceans mainly changes with changing…
A: The purpose of this experiment is to examine the claim that the surface temperature of the world's…
Q: =1881.3, S =0.281 =1890.3, S =0.263
A: As we can see in the first snip, the answers to TMed and S is already given. It is given that, TMed…
Q: Temperature (oC)(oC) 15 16 17 18 19 20 21 22 23 24 25 26 27 28 29 30 Percent heat loss from beak 33…
A:
Q: The regulation of electric and gas utilities is an important public policy question affecting…
A: Hi! Thank you for the question, As per the honor code, we are allowed to answer one question at a…
Q: A special education teacher did research on whether or not there is a relationship between the…
A: The correlation coefficient and slope are –0.863 and –1.212294, respectively.
Q: A business researcher is investigating the relationship between certain personality characteristics…
A: Given: X (Speed and impatience) 4 2 5 4 9 9 7 3 4 2 5 4 1 5 5…
Q: pound that the human nose can detect. The odor threshold for dimethyl sulfide (DMS) in trained wine…
A: Population standard deviation=8Margin of error=E=0.1
Q: The age-specific death rate for the over-65 age group is Age-Group Population Number of Deaths 65…
A: Formula for Age-specific death rate: Age specific death rate=Number of deaths in particular…
Trending now
This is a popular solution!
Step by step
Solved in 2 steps with 1 images
- ed weight (in kg) and total serum cholesterol (TSC in mg/dl) data for five men (n = 5). They tested for association between weight and TSC at 5% level of significance. weight, X TSC, Y X*X Y*Y X*Y 37 2.9 1369 8.41 107.3 50 0.7 2500 0.49 35.0 67 3.3 4489 10.89 221.1 70 4.2 4900 17.64 294.0 57 3.8 3249 14.44 216.6 SUM: 281 14.9 16507 51.87 874.0 What are the Null and Alternate hypotheses for this test? Clearly label your answers as HỌ or H1. (Do not use a numerical format. Both of your statements must be in sentence form, and say something about the weightol 106. Use the two scenarios presented in Figure 7.12 to answer the following question about the two sources of variability in ANOVA. 3.5 3.0 2.5 2.0 1.5 (i) HA: P₁ P2 ‡ P3 (iii) HA not all proportions are equal to this po 1.0 Figure 7.12: Within vs Between Variability in ANOVA onnisth Scenario A L (d) Recall that, O 2 H 3 2.05 2.10 2.15 2.20 2.25 2.30 2.35 (ii) Ho: M₁ M₂ = μ3 sans are (iv) HA: not all means are equal 720 qeaoluet alt sot mol 4 mobor 2924 (6) 2 3 4 gob za aim onbala (1) di batt (9) w-qodt fonqtotal bac o2 (6) (Troy ote12. (0) (a) Which scenario provides stronger evidence that the difference in factor level means represents true differences in the population means? Explain why in your own words. Scenario B 1 = stogol 05 O 1 oftaltete fest out of sulav gris I (b) Which scenario exhibits more variability within each factor level? Is this measured by SSError or SSFactor? Agulow (c) Which scenario exhibits more variability between each factor level? Is this measured by…Data on weekday exercise time for 20 females, consistent with summary quantities given in the paper "An Ecological Momentary Assessment of the Physical Activity and Sedentary Behavior Patterns of University Students,"† are shown below. Female—Weekday 10.0 90.6 48.5 50.4 57.4 99.6 0.0 5.0 0.0 0.0 5.0 2.0 10.5 5.0 47.0 0.0 5.0 54.0 0.0 48.6 Calculate the values of the median and interquartile range. median: interquartile range: Interpret the values of the median and interquartile range. The median exercise time of indicates that half of the exercise times were below , and the remaining half were above . The interquartile range tells us that the middle fifty percent of exercise times had a range of .
- A federal regulatory agency is investigating an advertised claim that a certain device can increase the gasoline mileage of cars (mpg). Ten such devices are purchased and installed in cars belonging to the agency. Gasoline mileage for each of the cars is recorded both before and after installation. The data are recorded here. Car 1 2 3 4 5 6 7 8 9 10 n x s Before (mpg) 19.1 29.9 17.6 20.2 23.5 26.8 21.7 25.7 19.5 28.2 10 23.22 4.25 After (mpg) 25.8 23.7 28.7 25.4 32.8 19.2 29.6 22.3 25.7 20.1 10 25.33 4.25 Change (mpg) 6.7 −6.2 11.1 5.2 9.3 −7.6 7.9 −3.4 6.2 −8.1 10 2.11 7.54 (a) The cars in the study appear to have grossly different mileages before the devices were installed. Use the change data to test whether there has been a significant gain in mileage after the devices were installed. Use ? = .05. H0: ?after ?before Ha: ?after ?before t = p-valueA researcher is conducting a test to see if handedness (right or left) affects the speed at which people perform a particular task. The researcher only knows the order in which the contestants finished. When the data are summarized (with R for right-handed and L for left-handed) the order of finishing (fastest to slowest) was: R, R, R, R, L, R, L, R, L, L Is there statistically significant evidence of an effect of handedness on the speed? Test statistic: The name of the statistical table, degrees of freedom (if appropriate), and the numerical value of the critical value for this test: P-value: Circle an appropriate conclusion: • There is significant evidence that left-handed contestants will finish the task faster. • We cannot reject the hypothesis that handedness has no effect on the time to finish the task. • There is significant evidence that right-handed contestants will finish the task faster.Search and Rescue of DND provides various statistics on boating accidents in he Maritimes and B.C. These statistics include information on the wind speed at the time of the accident. The following chart includes information recorded for 184 accidents on both coasts for the same time period: Wind Conditions Accidents West Coast Accidents East Coast Nil 13 6 Light 74 42 Moderate 30 15 Strong or higher 3 1 a) Suppose xe indicates the wind conditions in the East Coast where xe=0 indicates Nil, xe=1 indicates Light, xe = 2 indicates moderate and xe = 3 indicates Strong or Storm. Also suppose that xw indicates the wind conditions on the West Coast and xt indicates…
- The amounts (in dollars) paid by 20 students for textbooks during the fall term are given on the right. 22 44 29 55 27 35 25 51 64 62 24 47 62 59 35 42 27 53 65 59 Interval Frequency 10 - 19.99 20 - 29.99 30 - 39.99 40 - 49.99 50 - 59.99 60 - 69.99 Book Cost Does the histogram on the left represent this data? Yes А В С DE No A: 20 - 29.99 B: 30 - 39.99 C: 40 - 49.99 D: 50 - 59.99 E: 60 - 69.9941I need help with all parts of this question 18