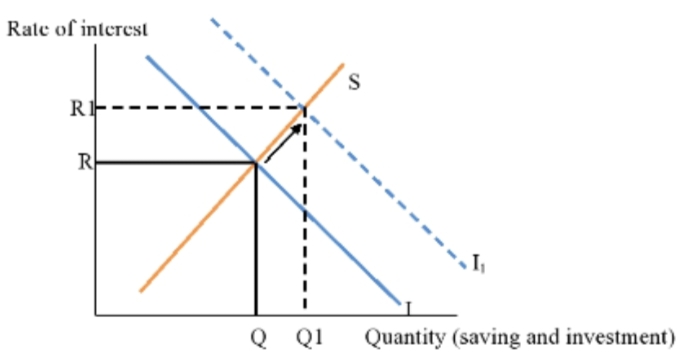
Draw the Saving-Investment diagram and illustrate the effects of the following shocks on the equilibrium level of interest rate, investment, and saving.

ANSWER:
(A).
Saving is an increasing function of the rate of interest. People save more at a higher rate of interest. There is an upward movement along the saving curve when the rate of interest increase and a downward movement along the saving curve when the rate of interest falls. A shift in saving curve occurs due to the changes in factors other the rate of interest. Investment is a decreasing fuction of the rate of interest. The people invest less at a higher interest rate and more at a lower interst rate. There is an upward movement along the investment curve when the rate of interest increases and downward movement along the investment curve when the rate of interest falls. The investment curve shift only when there is a change in factors other than the rate of interest. The equality of saving and investment determines the equilibrium rate of interest and the equilibrium quantity of saving demanded for invested.
An expected increase in productivity of factors increases the demand for saving or investment. The investment curve shift to the right. The rate of interest increase and the equilibrium quantity of saving and investment increase.

An expected increase in future productivity of factors shift the investment curve from I to I1.
The rate of interest increase from R to R1 and the equilibrium quantity of saving and investment increase from Q to Q1.
Step by step
Solved in 3 steps with 3 images


