Draw a supply and demand graph for the market for air travel. Analyze the impact of an increase in the cost of jet fuel. Be sure to use just one graph, shifting either the demand curve or the supply curve the correct direction. Show the impact on equilibrium price and equilibrium quantity.
Draw a
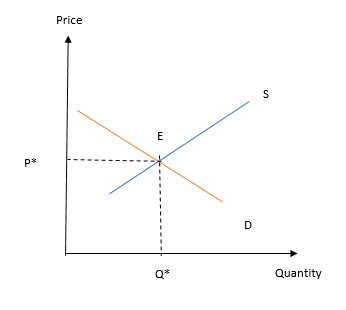
The following graph shows the market for air travel.
D is the demand curve depicting the inverse relationship between the price and quantity demanded of air travel.
S is the supply curve depicting the direct relationship between the price and the quantity supplied of air travel.
E is the initial equilibrium where D and S intersect. P* and Q* are the corresponding equilibrium price and quantity of air travel.

Trending now
This is a popular solution!
Step by step
Solved in 2 steps with 2 images


