Does the following boxplot show normal distribution? A condiiton for a two sample T test is normal distribution, hence, was this condition met?
Does the following boxplot show
![(0,9]
(14,19]
(19,25]
(9,14]
Exchanges Category
Rating
1.5
2.0
2.5
3.0
3.5](/v2/_next/image?url=https%3A%2F%2Fcontent.bartleby.com%2Fqna-images%2Fquestion%2Fcc5ed75b-c069-42a1-b0b9-bf2f14e82afc%2F48deac99-7c56-4435-8911-8e56466290c9%2F77t17vk_processed.png&w=3840&q=75)
Introduction -
Normal distribution - Normal distribution , also known as the Gaussian distribution , is a probability distribution that is symmetric about about the mean , showing that data near the mean are frequent in occurrence than data from the mean The graph of normal distribution will appear as a bell curve .
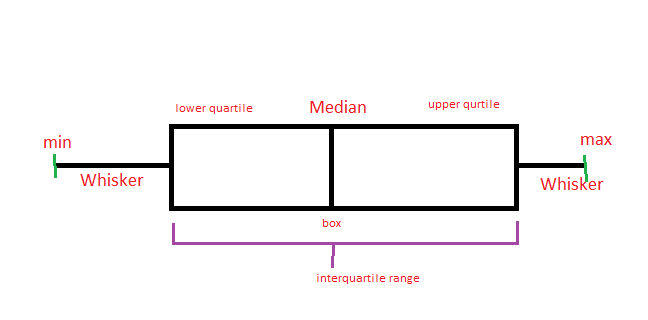
Box -plot - In descriptive statistics , a box plot or boxplot ( also known as box and whisker plot ) is a type of chart often used in explanatory data analysis .Box plots visually show the distribution of numerical data and skewness through dis[lying the data quartile or percentile and averages.

Step by step
Solved in 2 steps with 3 images


