Do cars get better gas mileage on the highway? The table shows the mileage per gallon of cars on city streets and the mileage per gallon of cars on the highway. Assume that the two samples are randomly selected. At the 0.1 significance level, test the claim that the mean difference in miles per gallon is higher for cars on the city streets. (Be sure to subtract in the same direction).


Do cars get better gas mileage on the highway?
The table shows the mileage per gallon of cars on city streets and the mileage per gallon of cars on the highway. Assume that the two samples are randomly selected. At the 0.1 significance level, test the claim that the
(Be sure to subtract in the same direction).


Given that,
Sample size
The difference between two paired samples is calculated using formula as follows:
|
City |
Highway |
Difference (d) |
| 27.7 | 31.9 | -4.20 |
| 17.6 | 16.5 | 1.10 |
| 18.8 | 27.5 | -8.70 |
| 28.2 | 34.6 | -6.40 |
| 21.3 | 26.4 | -5.10 |
| 19.1 | 30.4 | -11.3 |
| 28.3 | 26.7 | 2.00 |
| 20 | 24.1 | -4.10 |
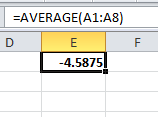
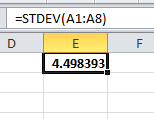
Mean and standard deviation of difference is calculated using EXCEL functions as given below:
Mean: “=AVERAGE (select array of data values)”
Standard deviation: “=STDEV (select array of data values)”
The mean of the difference is
Standard deviation of difference
Hypothesis:
(That is, the mean difference in miles per gallon is not higher for cars on the city streets.)
(That is, the mean difference in miles per gallon is higher for cars on the city streets.)
Degrees of freedom is
Test Statistic:
The test statistic value can be obtained as follows:

Step by step
Solved in 3 steps with 3 images


