directed on the surface of a crystal. The intensity of electrons detected at various angles of deflection is shown in the graph below: arbitrary units) W
directed on the surface of a crystal. The intensity of electrons detected at various angles of deflection is shown in the graph below: arbitrary units) W

Related questions
Question
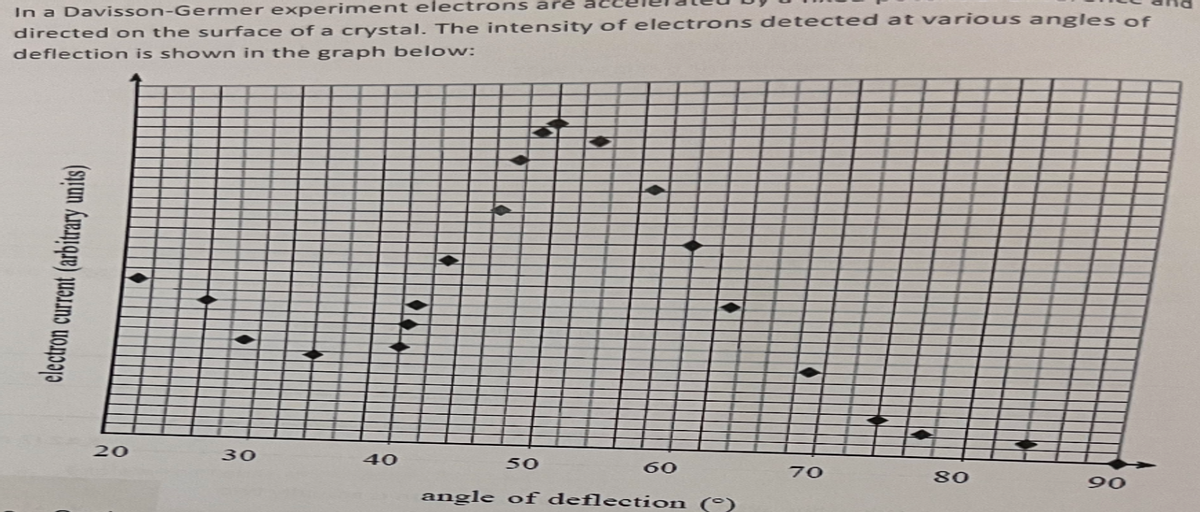
a) On the graph, draw a curve of best fit that shows the trend in the data points
b)Using your curve of best fit, determine the angle of deflection at which the maximum
electron current occurs
c) State and explain what can be inferred about electrons from this experiment

Transcribed Image Text:In a Davisson-Germer experiment electrons are
directed on the surface of a crystal. The intensity of electrons detected at various angles of
deflection is shown in the graph below:
electron current (arbitrary units)
20
♥
30
10
40
●
50
angle of deflection ()
60
70
80
90
Expert Solution
Step 1: Understanding the question
Given
In a Davisson-Germer experiment, the electric current detected at various angles of deflection is shown in the graph below
a) On the graph, draw a curve of best fit that shows the trend in the data points
b)Using your curve of best fit, determine the angle of deflection at which the maximum
electron current occurs
c) State and explain what can be inferred about electrons from this experiment

Step by step
Solved in 4 steps with 5 images
