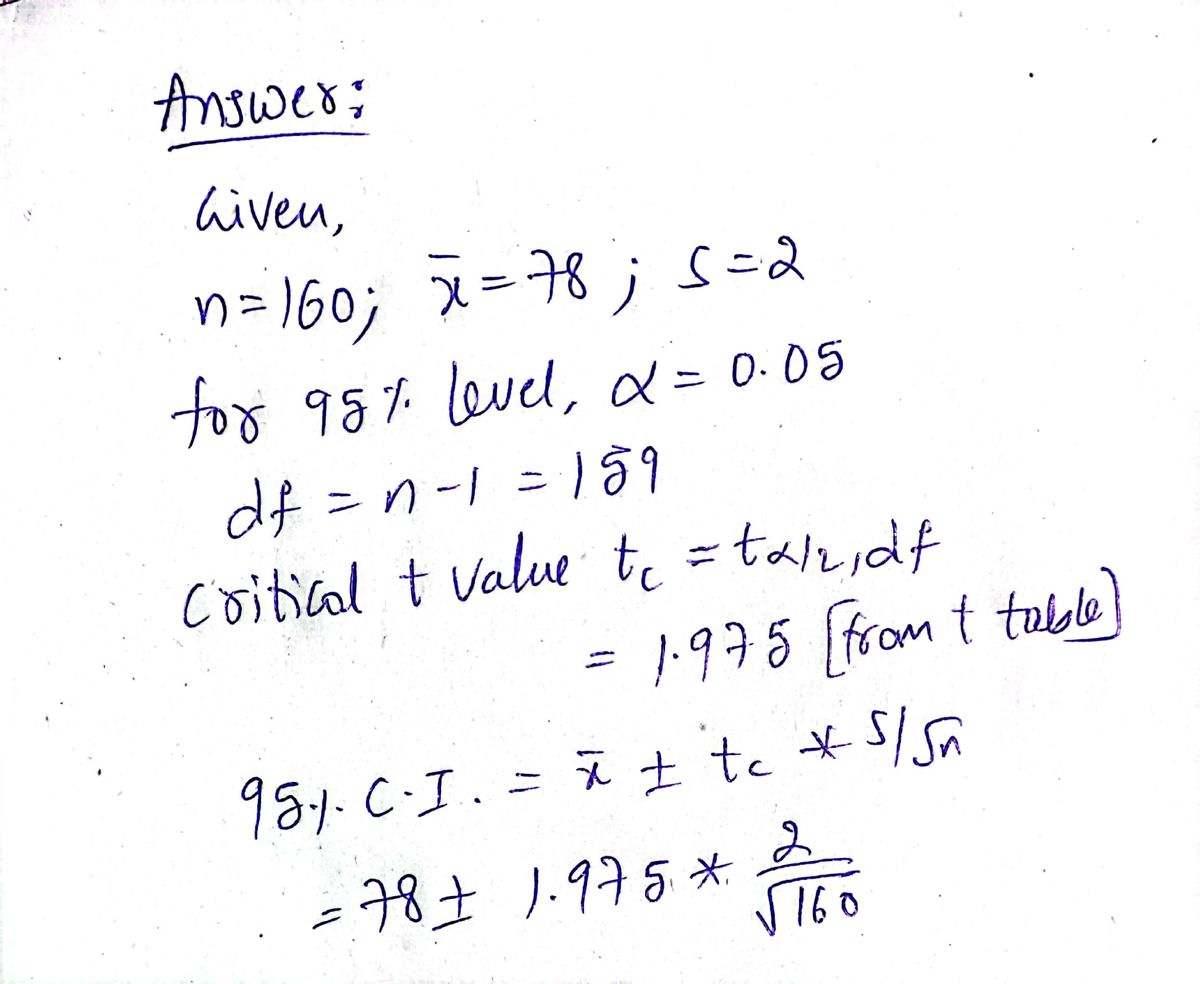
deviation of 2%. Calculate a 95% confidence interval for the population mean of students who took a support course. (Type numbers in Excel calculator without percent sign)
Q: 4) Would you feel confident claiming that the exercise class changes SPIRO, with 95% confidence
A:
Q: (4) Explain the following terms using basic language, as if you are explaining them to people who…
A: Missing data and Outliers are very important concepts, in the next section I will give description…
Q: 1. Use last digit of your student ID(I called it b) to do the following problem. Charges for…
A:
Q: 1. Explain what is meant by i. Primary data collection ii. Secondary data collection iii. State two…
A: Note: As per our guidelines we are supposed to answer only 3 subparts of any questions so i am…
Q: A school psychologist gathers data on emotional and behavioral problems in 373 children enrolled in…
A: It is given that ,a school psychologist gathers data on emotional and behavioral problems in 373…
Q: I need help wiht this thanks!
A: we need to:Compute the standard deviation of the data (values in the "RelativeTo1913"…
Q: 8. The primary purpose of inferential statistics is to: a. help the researcher draw conclusions from…
A: Statistics is broadly divides into two categories 1)Descriptive statistics 2)Inferential…
Q: O The American Statistical Association wishes to do a survey of its members in the United States on…
A: There are main four types of survey. 1) Telephonic Surveys, 2)Face-to-face Surveys, and 3)Online…
Q: The mode score on a statistics exam was 83. Which of these interpretations is correct? A.More…
A: Given information Mode score on a statistics exam = 83 Mode = The number having highest frequency is…
Q: 'hat are the two major types of statistics? Describe them in detail. elect the two major types of…
A: In this case, we need to identify the two major types of statistics.
Q: A new revolution in research that encourages collaboration, the sharing of data, and the ability to…
A:
Q: The following questions should be answered in the context of a large survey with which you are…
A: FOR ANY QUERIES PING ME
Q: Suppose you were taking a statistics course where the final grade breakdown ended up being the…
A: "Hello. Since your question has multiple parts, we will solve first question for you. If you want…
Q: Answer the following problems and explain your answers for better understanding.
A: Before we start, let's understand the difference between descriptive and inferential statistics.…
Q: I am wondering what statistical analysis would be best practice to use if I am comparing data from…
A: ANSWER: Comparing data from state to state can involve analysis of multiple variables and can be…
Q: Which of the following statements is correct? O i. The summaries of data, which may be tabular,…
A: It is given that the statements. Here, need to find out the correct statement.
Q: 4. For the following four examples, indicate whether each appears to be using descriptive or…
A: Descriptive statistics use the data to include population explanations either through numerical…
Q: 2. "In a recent study, 65% of city residents support increased spending on recreation. The study is…
A: Question 2 ) Given that - “In a recent study, 65% of city residents support increased spending on…
Q: Background: Morris Saldov conducted a study in Eastern and Central Newfoundland in 1988 to examine…
A: For the given data Perform Chi square test
Q: A recent survey of 2,000 Taylor Swift fans reported that the average fan paid $300 for concert…
A: Statistics can be divided into two principal areas: descriptive and inferential, each serving…
Q: For an article in a magazine, 20 different vehicles were selected to obtain data for comparison.…
A: The data is collected from 20 vehicles regarding the price, the fuel economy, the number of doors,…
Q: 10. Define the science of statistics, and what component of the science is most ‘important”.
A: Definition: The science of statistics is the discipline that concerns the collection, organization,…
Q: Which of the following is not true about the process of statistics? Question content area…
A: Solution A statistic is the measurement of the population.
Q: 1. true or false. In most situations in the “real word”, we know the value of the population…
A: 1. true or false. In most situations in the “real word”, we know the value of the population…
Q: (b) Define the relationship between X and Y. (You may select more than one answer. Single click the…
A: The data shows the floor space and weekly sales.
Q: In order to daw meaningful conclusion regarding the sex and race between of arrestees in New York…
A: In the given example, the data is gathered on all arrests made over one-year of period in New York…
Q: . A researcher is interested in choice and decisions. He looks at what people buy for lunch in a…
A: In the given problem, the variables, i.e., the choice and decisions, that are obtained are to be…
Q: Mary Turner owns and manages a small business in San Francisco, California. The business provides…
A: The given F-statistic value is 2.4.
Q: You saw back in Chapter 2 that the mean, median, mode, and midrange are used to indicate where data…
A: Given data: Set A: 50, 50, 50, 50, 50, 50, 50, 50, 50, 500 Set B: 20, 25, 30, 35, 40, 45, 100, 100,…
Q: The National Sleep Foundation recommends that adults aged 18 to 64 get an average of 8 hours of…
A:
Step by step
Solved in 2 steps with 2 images
- Do you need inferential statistics to answer each of the following questions? (Answer “yes” or “no” for each question) a. How many wheels are on a bicycle? b. How many bicycles are parked outside of the Starbucks at the corner of Boyd and Asp? c. What proportion of Belgium residents own bicycles? d. Do Oklahoma students outperform the national average on the college entrance exam? e. Did you outperform the national average on the college entrance exam? f. Is it hotter today in Tulsa than Topeka? g. Is the average temperature in Tulsa greater than that of Topeka1. Which of the following are examples of statistics? a) Average weight of all adult dogs.b) The 75th percentile of all adult dog weights.c) The largest dog eats lots of blueberry pizza.d) The weight of the largest dog ever.Do you need inferential statistics to answer each of the following questions? (Answer “yes” or “no” for each question) a. How many wheels are on a bicycle? b. How many bicycles are parked outside of the Starbucks at the corner of Boyd and Asp? c. What proportion of Belgium residents own bicycles? d. Do Oklahoma students outperform the national average on the college entrance exam? e. Did you outperform the national average on the college entrance exam? f. Is it hotter today in Tulsa than Topeka? g. Is the average temperature in Tulsa greater than that of Topeka
- What conclusions do you reach from this chart? A. There is an approximately equal percentage of males and females who enjoy shopping for clothing. B. There is a higher percentage of males who enjoy shopping for clothing. C. There is a higher percentage of females who enjoy shopping for clothing. D. The side-by-side bar chart is inconclusive. O A. Yes- No- 0. 100 200 300 400 Frequency Male C Femalewhen combined with high-quality research designs, statistics provide us with a greater sense of _____ in research personality subjectivity importance objectivityi need help with this question
- A) We have just conducted a study examining how much math anxiety students experience after taking a statistics class. We want to know if students on average are reporting low (1) or high (7) levels of math anxiety. To do that, we want to compare the math anxiety levels of the students after they have taken a statistics course to the average population math anxiety. We believe that the students on average will have a level of math anxiety that differs from the population. X 3 4 4 5 5 3 1 3 5 6 7 2 2 3 2 3 2 3 1 3 Report our null and alternative hypotheses in words. Given the information we have, what specific t-test do we need to run in order to examine our hypothesis? Provided are the ratings from the students that we recruited (see left), the mean and standard deviation for that sample (see below), and the population average (see below): xbar =3.35, Meu=4.00 and SD=1.60…The following is not a graded test. It is just a homework practice problems. Case Problem: Young Professional Magazine Young Professional magazine was developed for a target audience of recent college graduates who are in their first 10 years of a business or other professional career. The magazine has been fairly successful and the publisher is interested in expanding the publication’s advertising base. As a recent hire into the marketing department at the magazine, you have been asked to help develop a survey asking readers demographic information and questions about their interests. Your survey results will be used to help the magazine choose articles of interest and provide advertisers with a profile of subscribers. The culmination of your work will be a presentation of your findings to management. Therefore, you not only have to present summary data, but must also be able to explain the results in a manner that is accurate and easy to understand. Based on…