Determine whether there is a difference between the two data sets that is not apparent from a comparison of the measures of center. If so, what is it? O A. The times for customers in a single line are much more varied than the times for customers in individual lines. O B. The times for customers in individual lines are much more varied than the times for customers in a single line. O C. There is no difference between the two data sets
Determine whether there is a difference between the two data sets that is not apparent from a comparison of the measures of center. If so, what is it? O A. The times for customers in a single line are much more varied than the times for customers in individual lines. O B. The times for customers in individual lines are much more varied than the times for customers in a single line. O C. There is no difference between the two data sets

MATLAB: An Introduction with Applications
6th Edition
ISBN:9781119256830
Author:Amos Gilat
Publisher:Amos Gilat
Chapter1: Starting With Matlab
Section: Chapter Questions
Problem 1P

Related questions

Question

Transcribed Image Text:Waiting times (in minutes) of customers in a bank where all customers enter a single waiting line and a bank where customers wait in individual lines at three different teller windows are listed below. Find the mean and median for
each of the two samples, then compare the two sets of results.
Single Line
6.4
6.6
6.7
6.8
7.1
7.2
Individual Lines
7.5
7.8
7.8
7.8
4.2
5.2
5.9
6.2
6.5
7.8
7.8
8.6
9.5
10.0
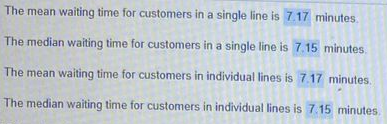
The mean waiting time for customers in a single line is 7.17 minutes.
The median waiting time for customers in a single line is 7.15 minutes.
The mean waiting time for customers in individual lines is 7.17 minutes.
The median waiting time for customers in individual lines is 7.15 minutes.
Determine whether there is a difference between the two data sets that is not apparent from a comparison of the measures of center. If so, what is it?
O A. The times for customers in a single line are much more varied than the times for customers in individual lines.
O B. The times for customers in individual lines are much more varied than the times for customers in a single line.
O C. There is no difference between the two data sets.
Expert Solution
Step 1
We can see that ,
Mean and Median of both the Data have same values .
Now we will calculate the standard deviation of both the samples to see the variability.

Trending now
This is a popular solution!

Step by step
Solved in 2 steps with 3 images

Knowledge Booster


Learn more about
Need a deep-dive on the concept behind this application? Look no further. Learn more about this topic, statistics and related others by exploring similar questions and additional content below.Recommended textbooks for you
MATLAB: An Introduction with Applications
Statistics
ISBN:
9781119256830
Author:
Amos Gilat
Publisher:
John Wiley & Sons Inc

Probability and Statistics for Engineering and th…
Statistics
ISBN:
9781305251809
Author:
Jay L. Devore
Publisher:
Cengage Learning

Statistics for The Behavioral Sciences (MindTap C…
Statistics
ISBN:
9781305504912
Author:
Frederick J Gravetter, Larry B. Wallnau
Publisher:
Cengage Learning
MATLAB: An Introduction with Applications
Statistics
ISBN:
9781119256830
Author:
Amos Gilat
Publisher:
John Wiley & Sons Inc
Probability and Statistics for Engineering and th…
Statistics
ISBN:
9781305251809
Author:
Jay L. Devore
Publisher:
Cengage Learning
Statistics for The Behavioral Sciences (MindTap C…
Statistics
ISBN:
9781305504912
Author:
Frederick J Gravetter, Larry B. Wallnau
Publisher:
Cengage Learning

Elementary Statistics: Picturing the World (7th E…
Statistics
ISBN:
9780134683416
Author:
Ron Larson, Betsy Farber
Publisher:
PEARSON

The Basic Practice of Statistics
Statistics
ISBN:
9781319042578
Author:
David S. Moore, William I. Notz, Michael A. Fligner
Publisher:
W. H. Freeman

Introduction to the Practice of Statistics
Statistics
ISBN:
9781319013387
Author:
David S. Moore, George P. McCabe, Bruce A. Craig
Publisher:
W. H. Freeman