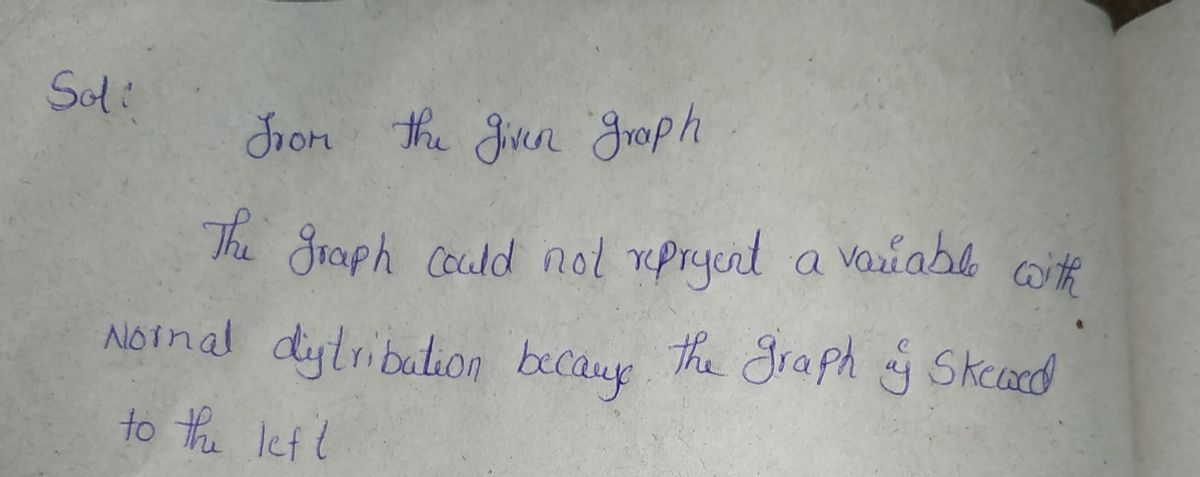
Determine whether the graph shown could represent a variable with a normal distribution. Explain your reasoning. If the graph appears to represent a normal distribution, estimate the mean and standard deviation. 20 23 26 29 32 35 38 41 44 Select the correct choice below and, if necessary, fill in the answer boxes to complete your choice. O A. The graph could not represent a variable with a normal distribution because the curve crosses the x-axis. O B. The graph could represent a variable with a normal distribution because the curve is symmetric and bell-shaped. Its mean is approximately standard deviation is approximately and its (Round to one decimal place as needed.) O C. The graph could not represent a variable with a normal distribution because the graph is skewed to the right. O D. The graph could not represent a variable with a normal distribution because the curve is constant. O E. The graph could not represent a variable with a normal distribution because the graph is skewed to the left. O F. The graph could not represent a variable with a normal distribution because the curve has two modes. Incorrec
Determine whether the graph shown could represent a variable with a normal distribution. Explain your reasoning. If the graph appears to represent a normal distribution, estimate the mean and standard deviation. 20 23 26 29 32 35 38 41 44 Select the correct choice below and, if necessary, fill in the answer boxes to complete your choice. O A. The graph could not represent a variable with a normal distribution because the curve crosses the x-axis. O B. The graph could represent a variable with a normal distribution because the curve is symmetric and bell-shaped. Its mean is approximately standard deviation is approximately and its (Round to one decimal place as needed.) O C. The graph could not represent a variable with a normal distribution because the graph is skewed to the right. O D. The graph could not represent a variable with a normal distribution because the curve is constant. O E. The graph could not represent a variable with a normal distribution because the graph is skewed to the left. O F. The graph could not represent a variable with a normal distribution because the curve has two modes. Incorrec

MATLAB: An Introduction with Applications
6th Edition
ISBN:9781119256830
Author:Amos Gilat
Publisher:Amos Gilat
Chapter1: Starting With Matlab
Section: Chapter Questions
Problem 1P

Related questions
Question

Transcribed Image Text:Determine whether the graph shown could represent a variable with a normal distribution. Explain your reasoning. If the graph
appears to represent a normal distribution, estimate the mean and standard deviation.
20 23 26 29 32 35 38 41 44
Select the correct choice below and, if necessary, fill in the answer boxes to complete your choice.
O A. The graph could not represent a variable with a normal distribution because the curve crosses the x-axis.
O B. The graph could represent a variable with a normal distribution because the curve is symmetric and bell-shaped. Its mean is approximately
and its
standard deviation is approximately
(Round to one decimal place as needed.)
O C. The graph could not represent a variable with a normal distribution because the graph is skewed to the right.
O D. The graph could not represent a variable with a normal distribution because the curve is constant.
O E. The graph could not represent a variable with a normal distribution because the graph is skewed to the left.
O F. The graph could not represent a variable with a normal distribution because the curve has two modes.
Incorrec
Expert Solution
Step 1

Trending now
This is a popular solution!

Step by step
Solved in 2 steps with 2 images

Recommended textbooks for you
MATLAB: An Introduction with Applications
Statistics
ISBN:
9781119256830
Author:
Amos Gilat
Publisher:
John Wiley & Sons Inc

Probability and Statistics for Engineering and th…
Statistics
ISBN:
9781305251809
Author:
Jay L. Devore
Publisher:
Cengage Learning

Statistics for The Behavioral Sciences (MindTap C…
Statistics
ISBN:
9781305504912
Author:
Frederick J Gravetter, Larry B. Wallnau
Publisher:
Cengage Learning
MATLAB: An Introduction with Applications
Statistics
ISBN:
9781119256830
Author:
Amos Gilat
Publisher:
John Wiley & Sons Inc
Probability and Statistics for Engineering and th…
Statistics
ISBN:
9781305251809
Author:
Jay L. Devore
Publisher:
Cengage Learning
Statistics for The Behavioral Sciences (MindTap C…
Statistics
ISBN:
9781305504912
Author:
Frederick J Gravetter, Larry B. Wallnau
Publisher:
Cengage Learning

Elementary Statistics: Picturing the World (7th E…
Statistics
ISBN:
9780134683416
Author:
Ron Larson, Betsy Farber
Publisher:
PEARSON

The Basic Practice of Statistics
Statistics
ISBN:
9781319042578
Author:
David S. Moore, William I. Notz, Michael A. Fligner
Publisher:
W. H. Freeman

Introduction to the Practice of Statistics
Statistics
ISBN:
9781319013387
Author:
David S. Moore, George P. McCabe, Bruce A. Craig
Publisher:
W. H. Freeman