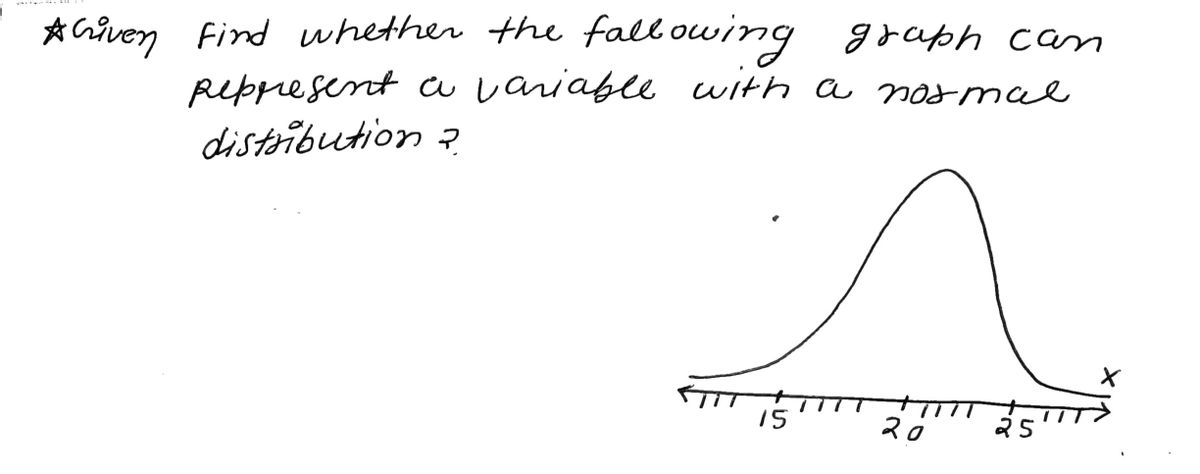
Determine whether the following graph can represent a variable with a normal distribution. Explain your reasoning. If the graph appears to represent a normal distribution, estimate the mean and standard deviation. 15 20 Could the graph represent variable with a normal distribution? Explain your reasoning. Select the correct choice below and, if necessary, fill in the answer boxes within your choice. O A. Yes, the graph fulfills the properties of the normal distribution. The mean is approximately and the standard deviation is about (Type whole numbers.) O B. No, because the graph is skewed right. O C. No, because the graph crosses the x-axis. O D. No, because the graph is skewed left.
Determine whether the following graph can represent a variable with a normal distribution. Explain your reasoning. If the graph appears to represent a normal distribution, estimate the mean and standard deviation. 15 20 Could the graph represent variable with a normal distribution? Explain your reasoning. Select the correct choice below and, if necessary, fill in the answer boxes within your choice. O A. Yes, the graph fulfills the properties of the normal distribution. The mean is approximately and the standard deviation is about (Type whole numbers.) O B. No, because the graph is skewed right. O C. No, because the graph crosses the x-axis. O D. No, because the graph is skewed left.

MATLAB: An Introduction with Applications
6th Edition
ISBN:9781119256830
Author:Amos Gilat
Publisher:Amos Gilat
Chapter1: Starting With Matlab
Section: Chapter Questions
Problem 1P

Related questions
Question

Transcribed Image Text:Determine whether the following graph can represent a variable with a nomal distribution. Explain your reasoning. If the graph appears to represent a normal distribution, estimate the mean and
standard deviation.
15
20
Could the graph represent
variable with a normal distribution? Explain your reasoning. Select the correct choice below and, if necessary, fill in the answer boxes within your choice.
O A. Yes, the graph fulfills the properties of the normal distribution. The mean is approximately and the standard deviation is about
(Type whole numbers.)
O B. No, because the graph is skewed right.
O C. No, because the graph crosses the x-axis.
O D. No, because the graph is skewed left.
Expert Solution
Step 1

Trending now
This is a popular solution!

Step by step
Solved in 2 steps with 2 images

Recommended textbooks for you
MATLAB: An Introduction with Applications
Statistics
ISBN:
9781119256830
Author:
Amos Gilat
Publisher:
John Wiley & Sons Inc

Probability and Statistics for Engineering and th…
Statistics
ISBN:
9781305251809
Author:
Jay L. Devore
Publisher:
Cengage Learning

Statistics for The Behavioral Sciences (MindTap C…
Statistics
ISBN:
9781305504912
Author:
Frederick J Gravetter, Larry B. Wallnau
Publisher:
Cengage Learning
MATLAB: An Introduction with Applications
Statistics
ISBN:
9781119256830
Author:
Amos Gilat
Publisher:
John Wiley & Sons Inc
Probability and Statistics for Engineering and th…
Statistics
ISBN:
9781305251809
Author:
Jay L. Devore
Publisher:
Cengage Learning
Statistics for The Behavioral Sciences (MindTap C…
Statistics
ISBN:
9781305504912
Author:
Frederick J Gravetter, Larry B. Wallnau
Publisher:
Cengage Learning

Elementary Statistics: Picturing the World (7th E…
Statistics
ISBN:
9780134683416
Author:
Ron Larson, Betsy Farber
Publisher:
PEARSON

The Basic Practice of Statistics
Statistics
ISBN:
9781319042578
Author:
David S. Moore, William I. Notz, Michael A. Fligner
Publisher:
W. H. Freeman

Introduction to the Practice of Statistics
Statistics
ISBN:
9781319013387
Author:
David S. Moore, George P. McCabe, Bruce A. Craig
Publisher:
W. H. Freeman